27
Shipping and Visualizing Jenkins Logs with LOGIQ
Jenkins is by far the leading open-source automation platform. A majority of developers turn to Jenkins to automate processes in their development, test, and deployment pipelines. Jenkins’ support for plugins helps automate nearly every task and set up robust continuous integration and continuous delivery pipelines.
Jenkins provides logs for every Job it executes. These logs offer detailed records related to a Job, such as a build name and number, time for completion, build status, and other information that help analyze the results of running the Job. A typical large-scale implementation of Jenkins in a multi-node environment with multiple pipelines generates tons of logs, making it challenging to identify errors and analyze their root cause(s) whenever there’s a failure. Setting up centralized observability for your Jenkins setup can help overcome these challenges by providing a single pane to log, visualize, and analyze your Jenkins logs. A robust observability platform enables you to debug pipeline failures, optimize resource allocation, and identify bottlenecks in your pipeline that hamper faster delivery.
We’ve all come across numerous articles that discuss using the popular ELK stack to track and analyze Jenkins logs. While the ELK stack is a popular service for logging and monitoring, its use can be a little challenging. While the ELK stack performs brilliantly in simple, single-use scenarios, it struggles with manageability and scalability in large-scale deployments. Additionally, their associated costs (and changes in Elastic Licensing) might raise a few eyebrows. LOGIQ, on the other hand, is a true-blue observability PaaS that helps you ingest log data from Kubernetes, on-prem servers or cloud VMs, applications, and several other data sources without a price shock. As LOGIQ uses S3 as the primary storage layer, you get better control and ownership over your data and as much as 10X reductions in costs in large-scale deployments. In this article that’s part of a two-article series, we’ll demonstrate how you can get started with Jenkins log analysis using LOGIQ. We’ll walk you through installing Logstash, setting up your Jenkins instance, and ingesting log data into LOGIQ to visualize and analyze your Jenkins logs.
Before we dive into the demo, here’s what you’d need in case you’d like to follow along and try integrating your Jenkins logs with LOGIQ:
Logstash is a free server-side data processing pipeline that ingests data from many sources, transforms it, and then sends it to your favourite stash. We’ll use Logstash as an intermediary between Jenkins and LOGIQ that grooms your Jenkins log data before being ingested by LOGIQ.
To install Logstash on your local (Ubuntu) machine, run the following commands in succession:
wget -qO - https://artifacts.elastic.co/GPG-KEY-elasticsearch | sudo apt-key add -sudo apt-get install apt-transport-httpsecho "deb https://artifacts.elastic.co/packages/7.x/apt stable main" | sudo tee -a /etc/apt/sources.list.d/elastic-7.x.listsudo apt-get update && sudo apt-get install logstashFor detailed instructions on installing Logstash on other OSs, refer to the official Logstash documentation.
Now that we’ve installed Logstash download the flatten configuration and place it in your desired directory. The flatten configuration helps structure data before ingestion into LOGIQ. Once you’ve downloaded the flatten configuration, use the following Logstash configuration to push your Jenkins logs to LOGIQ:
input {
  tcp {
    port => 12345
    codec => json
  }
}
output { stdout { codec => rubydebug } }
filter {
    split {
        field => "message"
    }
  mutate {
    add_field => { "cluster_id" => "JENKINS-LOGSTASH" }
    add_field => { "namespace" => "jenkins-ci-cd-1" }
    add_field => { "application" => "%{[data][fullProjectName]}" }
    add_field => { "proc_id" => "%{[data][displayName]}" }
  }
ruby {
        path => "/home/yourpath/flattenJSON.rb"
        script_params => { "field" => "data" }
    }
}
output {
  http {
        url => "http://<logiq-instance>/v1/json_batch"
        http_method => "post"
        format => "json_batch"
        content_type => "application/json"
        pool_max => 300
        pool_max_per_route => 100
       }
}Note: Make sure you change the path in the configuration to the path where you downloaded the flatten configuration file. Also, remember to replace the LOGIQ endpoint with the endpoint of your LOGIQ instance. If you haven’t provisioned LOGIQ yet, you can do so by following one of our quickstart guides.
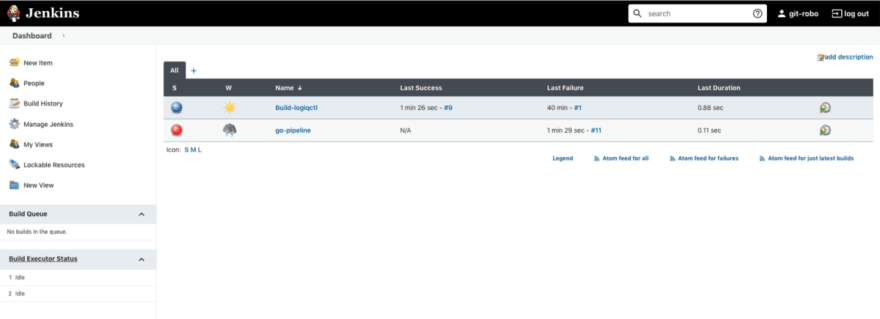
Now that we’ve got Logstash ready to go, let’s go ahead and configure Jenkins to use Logstash. For this demo, we’ve created two Jenkins pipeline jobs whose logs we’ll push to Logstash. You can use your own Jenkins logs when following along.

To push Jenkins logs to Logstash, we first need to install the Logstash plugin on Jenkins. To install Logstash, do the following:

After installing Logstash, we’ll go ahead and configure and enable Jenkins to push logs to Logstash. To configure Jenkins, do the following:

Note: In this example, we’ve entered the IP address and port number of the local Ubuntu machine on which we installed Logstash. Ensure that you provide the IP address and port number of the machine where you’ve installed Logstash.
Your Jenkins instance is now ready to push logs to Logstash
We’ve got Jenkins ready to ship logs to Logstash and Logstash prepared to pick them up and groom them for ingestion into LOGIQ. Let’s go ahead and start Logstash from the installation folder (
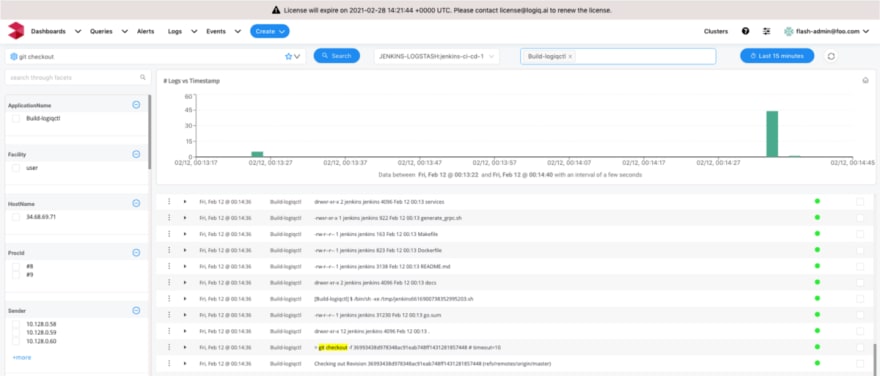
/usr/share/logstash) and pass the custom configuration file we prepared above using the following command:/usr/share/logstash# bin/logstash -f /etc/logstash/logstash-sample.confThat’s it! Your logging pipeline is up and running. Now when you head over to the Logs page on your LOGIQ dashboard, you’ll see all of your Jenkins logs that Logstash pushed to LOGIQ.

From here, you can create custom metrics from your logs, create events and alerts, and set up powerful dashboards that help visualize your log data.

This completes our overview on shipping and visualizing your Jenkins logs with LOGIQ. In a future article, we'll show you exactly how you can create powerful visualizations from your Jenkins logs. In the meanwhile, do drop a comment or reach out to us in case have any questions or would like to know more about how LOGIQ can bring in multi-dimensional observability to your applications and infrastructure and bring your log data to life.
27
