3 fundamental monitoring methods essential for every DevOps engineer 🚀💥

The USE Method | The RED method | The Four Golden Signals

Running applications at scale is no mean task. Applications are more global now than ever. And with that scale comes the complexity of managing numerous systems, services & third-party integrations.

Modern-day distributed systems are fraught with challenges and pitfalls at each stage of their lifecycle: development, testing, deployment, and running in production.

The most critical stage is when your application is out there in the hands of its users. Both your infrastructure and application services need to be continually monitored for issues that might affect end-user experience.

But modern systems can emit thousands or millions of metrics, and modern monitoring tools can collect it all. But that's never efficient.

In this article, I want to talk about some of the methodologies used for monitoring applications. These methodologies can direct your monitoring strategies and serve as excellent starting points to get more visibility into your deployed applications.

These methods give you a solid starting point to determine what you should monitor. 🔍

Check out our GitHub repo👇

GitHub logo SigNoz / signoz

SigNoz helps developers monitor their applications & troubleshoot problems, an open-source alternative to DataDog, NewRelic, etc. 🔥 🖥. 👉 Open source Application Performance Monitoring (APM) & Observability tool

SigNoz-logo

Monitor your applications and troubleshoot problems in your deployed applications, an open-source alternative to DataDog, New Relic, etc.

License Downloads GitHub issues tweet

Documentation • ReadMe in Chinese • Slack Community • Twitter

SigNoz helps developers monitor applications and troubleshoot problems in their deployed applications. SigNoz uses distributed tracing to gain visibility into your software stack.

👉 You can see metrics like p99 latency, error rates for your services, external API calls and individual end points.

👉 You can find the root cause of the problem by going to the exact traces which are causing the problem and see detailed flamegraphs of individual request traces.

SigNoz Feature

Join our Slack community

Come say Hi to us on Slack đź‘‹

Features:

  • Application overview metrics like RPS, 50th/90th/99th Percentile latencies, and Error Rate
  • Slowest endpoints in your application
  • See exact request trace to figure out issues in downstream services, slow DB queries, call to 3rd party services like payment…

The USE method

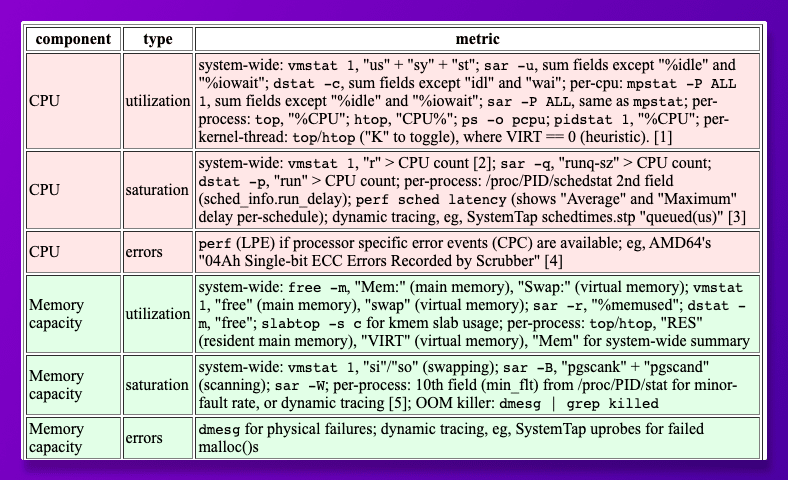
USE is an acronym for Utilization, Saturation, and Errors. It was devised by Brenden Gregg, who is quite known for his work in systems performance analysis. This method can be used to solve common performance issues quickly without overlooking important areas.

"Like an emergency checklist in a flight manual, it is intended to be simple, straightforward, complete, and fast."
-Brenden Gregg

The USE method can be summarized as:
For every resource, check utilization, saturation, and errors.

The metrics are usually expressed in the following terms:

  • utilization: the average time that the resource was busy servicing work.
  • saturation: the degree to which the resource has extra work which it can't service, often queued.
  • errors: the count of error events.

An example of USE-based metric list for linux operating systems👇

The RED method

RED stands for three metrics that you should measure for every microservice in your architecture. The metrics are:

  • Request rates - the number of requests per second your services are serving.
  • Errors - the number of failed requests per second.
  • Duration - distributions of the amount of time each request takes.

The RED metrics focus on measuring things that end-users care about when using your services.

RED metrics can be easily tracked with APM & observability tools like SigNoz.

Request rates give you an idea about the bandwidth of a service being used. It can help you avoid failure by monitoring peak traffic.

Errors have a direct impact on end-user experience, and hence errors rates are necessary to be monitored. Incorrect, incomplete, or unexpected user requests can be defined as errors. Identifying the exact cause of errors can be a real pain point for tech teams, often requiring deep-dive into application code. This is where performance monitoring apps like SigNoz can help.

Duration in microservices context is usually found out using a method called distributed tracing. In a nutshell, distributed tracing is a method through which a user request is tracked across different services, measuring the time taken by events through each microservice.

The Four Golden Signals by Google

The four golden signals by Google are closely related to the RED metrics. In fact, RED metrics are an off-shoot of the golden signals.

Google's site reliability engineers defined the four golden monitoring signals as latency, traffic, errors, and saturation.

Latency

Slow is the new down, they say. Latency is defined as the time it takes to service a request. Google also cautions to distinguish between the latency of successful requests and the latency of failed requests. Failed requests can be quick, but if included in latency calculations, they can be misleading.

Traffic

Traffic is a measure of the amount of activity in your application. It can be measured in any high-level system specific metric. For example, in web applications, traffic is usually measured by HTTP requests per second.

Errors

Errors, as discussed earlier, are the rate of requests that fail. This can be instances of explicit errors like HTTP 500s or implicit ones like HTTP 200s with wrong content delivered.

Saturation

As the name suggests, saturation is how 'full' your system is. Saturation of a system can be challenging to measure at times. It is directly related to the utilization metrics of a system. Sometimes, failures can occur even when the system is not 100% utilized. Hence, deciding on a utilization target is important.

Measuring saturation is also system-specific. For example, for memory-constrained systems, memory usage is used. For databases and streaming applications, disk I/O rates can be used.

With these methods, you can set out to build monitoring practices in your organization. Choosing the right tool to monitor your application is critical in this regard.

If you're interested, check out SigNoz - a full-stack open-source APM & observability tool. You can self-host it to get started with monitoring your RED metrics. SigNoz uses OpenTelemetry for instrumentation which supports all popular languages like Java, Python, Golang, Nodejs, etc.

Check out our GitHub repo 👇

GitHub logo SigNoz / signoz

SigNoz helps developers monitor their applications & troubleshoot problems, an open-source alternative to DataDog, NewRelic, etc. 🔥 🖥. 👉 Open source Application Performance Monitoring (APM) & Observability tool

SigNoz-logo

Monitor your applications and troubleshoot problems in your deployed applications, an open-source alternative to DataDog, New Relic, etc.

License Downloads GitHub issues tweet

Documentation • ReadMe in Chinese • Slack Community • Twitter

SigNoz helps developers monitor applications and troubleshoot problems in their deployed applications. SigNoz uses distributed tracing to gain visibility into your software stack.

👉 You can see metrics like p99 latency, error rates for your services, external API calls and individual end points.

👉 You can find the root cause of the problem by going to the exact traces which are causing the problem and see detailed flamegraphs of individual request traces.

SigNoz Feature

Join our Slack community

Come say Hi to us on Slack đź‘‹

Features:

  • Application overview metrics like RPS, 50th/90th/99th Percentile latencies, and Error Rate
  • Slowest endpoints in your application
  • See exact request trace to figure out issues in downstream services, slow DB queries, call to 3rd party services like payment…


32