
38
Get Prometheus Metrics from a Express.js app
I use Prometheus all the time for metrics and alert monitoring in Kubernetes. I decided to see how to setup monitoring in a Node/Express.js app. A quick search of npmjs and I found these two package prom-client a really detailed Prometheus client and express-prom-bundle which uses
prom-client under the hood, I choose express-prom-bundle as it was a quick win and was producing metrics with a few lines of code, my repo is here. I installed the following packages in my express appnpm install prom-client express-prom-bundle --saveThen added the Prometheus middleware to all routes
const express = require('express');
const app = express();
const promBundle = require("express-prom-bundle");

// Add the options to the prometheus middleware most option are for http_request_duration_seconds histogram metric
const metricsMiddleware = promBundle({
    includeMethod: true,
    includePath: true,
    includeStatusCode: true,
    includeUp: true,
    customLabels: {project_name: 'hello_world', project_type: 'test_metrics_labels'},
    promClient: {
        collectDefaultMetrics: {
        }
      }
});
// add the prometheus middleware to all routes
app.use(metricsMiddleware)

// default endpoint
app.get("/",(req,res) => res.json({
    "GET /": "All Routes",
    "GET /hello": "{hello:world}",
    "GET /metrics": "Metrics data",
    "POST /bye": "POST Request: + post data"
}));
// hello world rest endpoint
app.get("/hello", (req,res) => res.json({hello:"world"}));
app.post("/bye", (req,res) => res.send("POST Request : "+ req));

app.listen(8080, function () {
    console.log('Listening at http://localhost:8080');
  });
Running the app
npm start
> express-prometheus@1.0.0 start /home/austincunningham/repo/express-prometheus
> node index.js
Listening at http://localhost:8080
# curl the hello world endpoint
curl localhost:8080/hello
{"hello":"world"}%
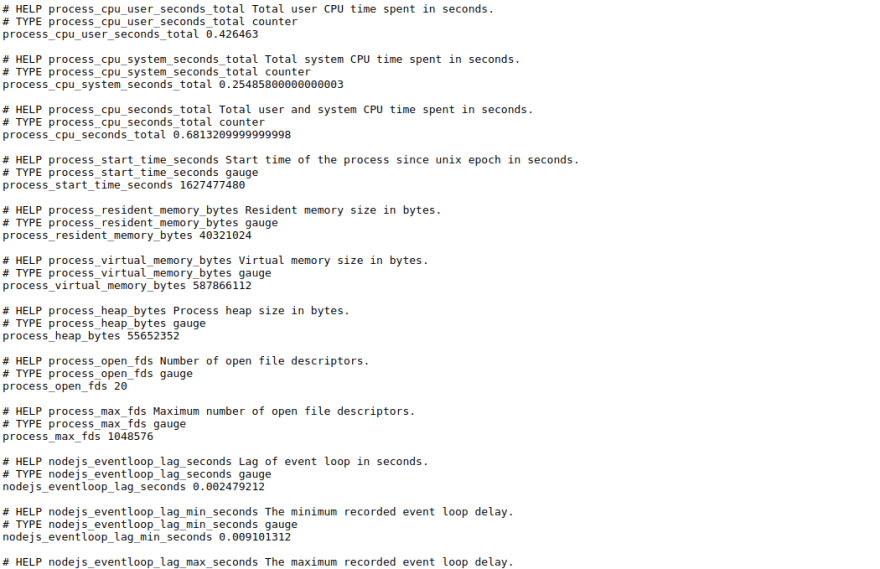
# curl the metrics endpoint
curl localhost:8080/metrics
# HELP process_cpu_user_seconds_total Total user CPU time spent in seconds.
# TYPE process_cpu_user_seconds_total counter
process_cpu_user_seconds_total 0.120868
# I cut the metrics output short here as its a lot of text but you get the ideaI am using crc which is local Kubernetes development environment based on Red Hat Openshift. I create a container for the app based on the following DockerFile
# syntax=docker/dockerfile:1

FROM node:12.18.1

WORKDIR /app

COPY ["package.json", "package-lock.json*", "./"]

RUN npm install

COPY . .

CMD [ "node", "index.js" ]
I then build, test the image locally and push the image
docker build -t quay.io/austincunningham/express-prometheus:v1.0.0 .
docker run -p 8080:8080 quay.io/austincunningham/express-prometheus:v1.0.0
Listening at http://localhost:8080
docker push quay.io/austincunningham/express-prometheus:v1.0.0
I can then deploy this on crc/openshift with the following two files
deployment.yaml
deployment.yaml
apiVersion: apps/v1
kind: Deployment
metadata:
  name: example-app
spec:
  replicas: 3
  selector:
    matchLabels:
      app: example-app
  template:
    metadata:
      labels:
        app: example-app
    spec:
      containers:
      - name: example-app
        image: quay.io/austincunningham/express-prometheus:v1.0.0
        ports:
        - name: web
          containerPort: 8080
service.yaml
kind: Service
apiVersion: v1
metadata:
  name: example-app
  labels:
    app: example-app #--> this is used for scraping the service via the serviceMonitor
spec:
  selector:
    app: example-app
  ports:
  - name: web
    port: 8080
Apply the files to the default project
oc project default
oc apply -f deployment.yaml
oc apply -f service.yaml
service/example-app created
# create a route to the service so you can access from the browser
oc expose service example-app
route.route.openshift.io/example-app exposed
You can test the route by hitting the /metrics path in the browser you should see
I am following the prometheus operator getting started guide. Applied the bundle from the setup on the default namespace
oc project default
oc apply -f https://raw.githubusercontent.com/prometheus-operator/prometheus-operator/master/bundle.yamlNOTE: Hit a issue where the prometheus-operator pod was in a crash loop backoff :(
Openshift has an operator hub so I did the following to fix the crashing operator pod. First I deleted the existing prometheus-operator deployment
oc delete deployment prometheus-operatorLogged in to crc/Openshift console as kubeadmin, in the administrator view go to OperatorHub and search for prometheus
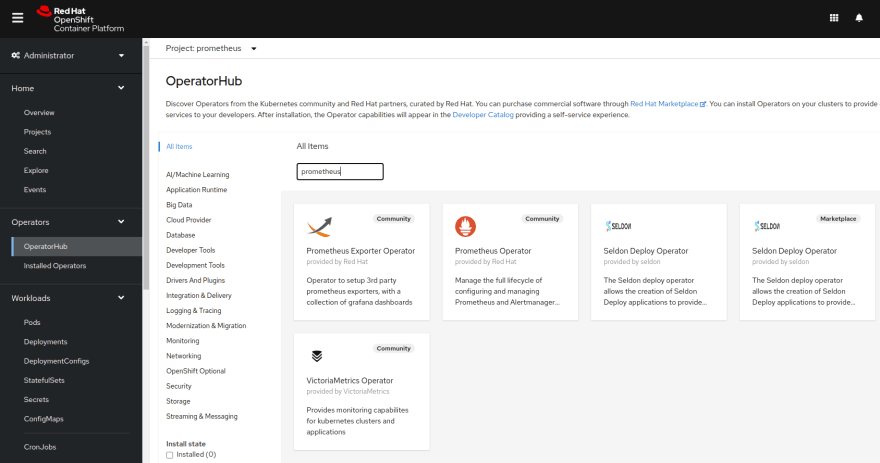
Select the

Select the default namespace from the drop down and install button again
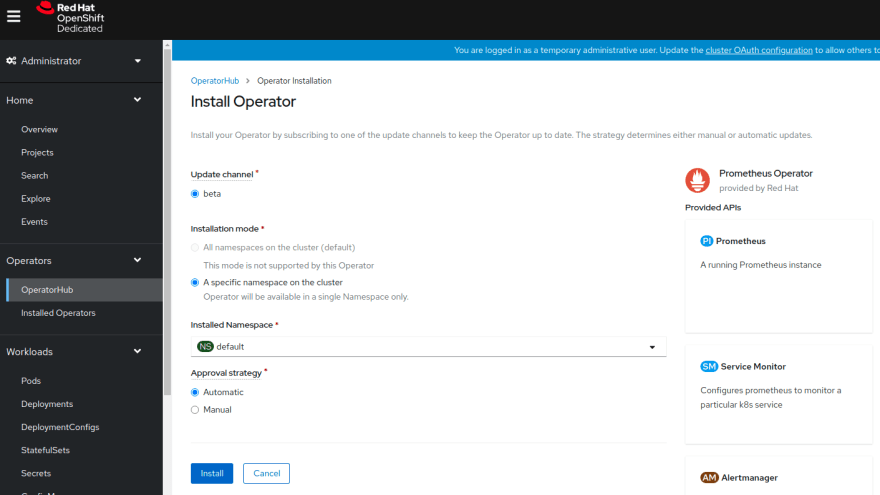
Select the
Prometheus Operator tile and continue then select install buttonSelect the default namespace from the drop down and install button again
Phew! that took longer to explain that to do.
First we add the Prometheus CR(custom resource) to the default namespace to start the Prometheus instance
prometheus.yaml
prometheus.yaml
apiVersion: monitoring.coreos.com/v1
kind: Prometheus
metadata:
  name: prometheus
spec:
  serviceAccountName: prometheus
  serviceMonitorSelector:
    matchLabels:
      team: frontend # --> this is used by prometheus to scrape the serviceMonitor
  resources:
    requests:
      memory: 400Mi
  enableAdminAPI: false
And add the service
prometheus-service.yaml
prometheus-service.yaml
kind: Service
apiVersion: v1
metadata:
  name: prometheus-operated
  namespace: default
  labels:
    operated-prometheus: 'true'
spec:
  ports:
    - name: web
      protocol: TCP
      port: 9090
      targetPort: web
  selector:
    app: prometheus
Apply the files and create a route
oc apply -f prometheus.yaml
oc apply -f prometheus-service.yaml
oc expose service prometheus-operated
The way Prometheus scrapes metrics is that it uses a service monitor to check a
service for a particular label. We have already created the service when we deployed the example-app with the label app: example-app in metadata.labels.Next we create a serviceMonitor in the default namespace and with a
service-monitor.yaml
selector for the app: example-app label. So we create the following file.service-monitor.yaml
apiVersion: monitoring.coreos.com/v1
kind: ServiceMonitor
metadata:
  name: example-app
  labels:
    team: frontend # --> this should match the serviceMonitorSelector in the prometheus CR
spec:
  selector:
    matchLabels:
      app: example-app # --> this should match the label in the service in example-app
  endpoints:
  - port: web
NOTE metadata.labels team: frontend we will use this later.
We upload the service-monitor.yaml file to the default namespace to create the serviceMonitor
oc apply -f service-monitor.yamlIn the prometheus.yaml CR we have already selected the service monitor this is done via
serviceMonitorSelector label with the label team: frontend Finally we need some RBAC rules which is Kubernetes version of permissions to allow Prometheus to see everything
Setup a service account, clusterRole and clusterRoleBinding. Create the following files
service-account.yaml
service-account.yaml
apiVersion: v1
kind: ServiceAccount
metadata:
  name: prometheus
clusterRole.yaml
apiVersion: rbac.authorization.k8s.io/v1
kind: ClusterRole
metadata:
  name: prometheus
rules:
- apiGroups: [""]
  resources:
  - nodes
  - nodes/metrics
  - services
  - endpoints
  - pods
  verbs: ["get", "list", "watch"]
- apiGroups: [""]
  resources:
  - configmaps
  verbs: ["get"]
- apiGroups:
  - networking.k8s.io
  resources:
  - ingresses
  verbs: ["get", "list", "watch"]
- nonResourceURLs: ["/metrics"]
  verbs: ["get"]
clusterRoleBinding.yaml
apiVersion: rbac.authorization.k8s.io/v1
kind: ClusterRoleBinding
metadata:
  name: prometheus
roleRef:
  apiGroup: rbac.authorization.k8s.io
  kind: ClusterRole
  name: prometheus
subjects:
- kind: ServiceAccount
  name: prometheus
  namespace: default
Apply the files to the default namespace
oc apply -f service-account.yaml
oc apply -f clusterRole.yaml
oc apply -f clusterRoleBinding.yaml
You should be able to access the route the default namespace
oc get routes
NAME          HOST/PORT                              PATH   SERVICES      PORT   TERMINATION   WILDCARD
example-app   example-app-default.apps-crc.testing          example-app   web                  None
prometheus    prometheus-default.apps-crc.testing           prometheus    web                  None
You can open the Prometheus UI by adding a http:// to the Prometheus HOST/PORT returned from the oc get routes command

It takes a little while for the Prometheus operator to reconcile and to show up the new resources. In the Prometheus ui first check the

Status\Service Discovery you should see example-app show upNOTE: be patient it can take a while to show up
Then check the
Status\Targets should see the following targets up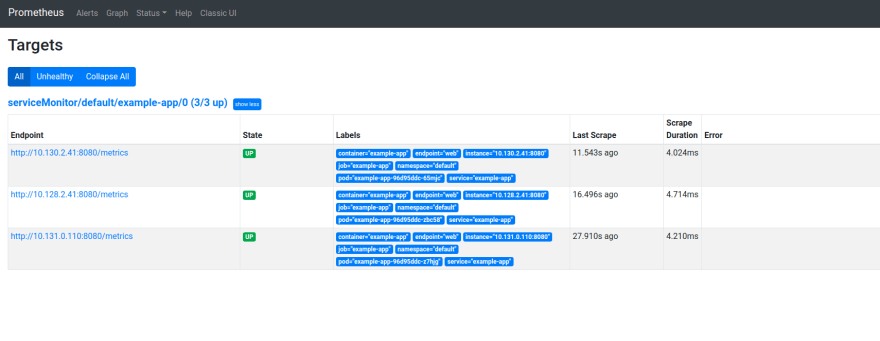
You also should be able to see metrics from example-app in the graph tab

That it I may do a follow up on setting up Grafana to use these metrics
38