46
Root out the odd operation with Operations Breakdown
Transactions are sent when your service receives a request and sends a response, like an API call or a page load. Within each transaction is a series of operations. We built Operations Breakdown to help you, the developer, quickly see how much time was spent in each operation within a transaction. Why? Simple, so you can address the operations with the longest duration and likely causing annoying performance issues for your customer.

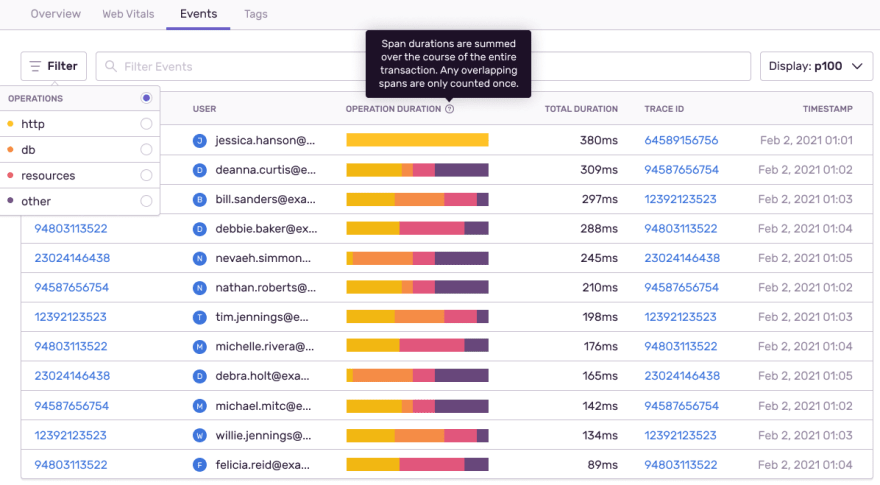
Each color denotes the type of operation, such as http, db, resource and browser. It also allows you to visualize change over time for each operation type and find transactions with unusual distributions of operations that could point to an underlying problem.
Fun fact: We use Sentry to monitor Sentry, shocker. We started using Operations Breakdown when it was early in development. Seeing that some transactions spent much more time in the database than other similar transactions surfaced a previously unknown n+1 issue. Checkout the PR for the fix.
In the example below, most transactions have a pattern that shows a mix of different operations, and one that is entirely composed of http operations, marked in yellow. That event is worth investigating some more...

You can dive deeper into an individual event and see the details of a particular span.

Another way you can use Operations Breakdown is to track the distribution of operations over time to see if the distribution changes dramatically. If an irregularity develops, this could indicate a slow database query that could be caused by a growing database.

Whether it’s timeouts, slow loading pages, or errors causing performance problems, with Operations Breakdown you see which operations have the greatest impact on your performance so your team can make improvements that drive the biggest gains.
Try Sentry for free today or contact us at sales@sentry.io to get started.
46
