
37
Integrate an Application with Prometheus Operator and Package with a Helm Chart
In the previous posts, we saw:
In this post we will:
Prometheus will retrieve metrics from Pods with a
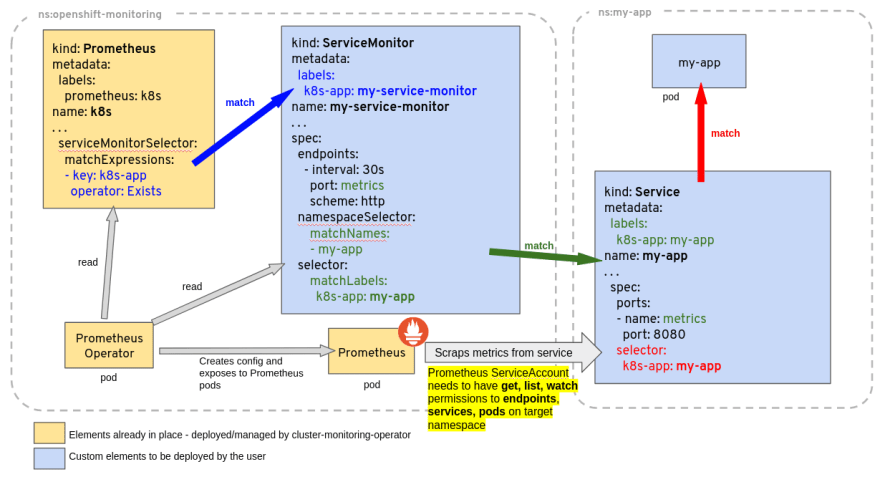
/metrics HTTP endpoint. If the Prometheus Operator is deployed in your Kubernetes Cluster, the discovery of the Pods is done by deploying one of the following custom Kubernetes objects:When a ServiceMonitor object is deployed, Prometheus will create one target per address defined in the Endpoints object linked to the Service. This means every Pod is in a ready status used by the Service.
For example, if you have the following Service and Deployment in your cluster:
apiVersion: v1
kind: Service
metadata:
  name: webapp
  labels:
    component: backend
    instance: app
    name: containers-my-app
  namespace: my-app
spec:
  type: ClusterIP
  ports:
  - name: http
    port: 80
    protocol: TCP
    targetPort: webapp
  selector:
    component: backend
    instance: app
name: containers-my-appapiVersion: apps/v1
kind: Deployment
metadata:
name: webapp
labels:
component: backend
instance: app
name: containers-my-app
namespace: my-app
spec:
selector:
matchLabels:
component: backend
instance: app
name: containers-my-app
template:
metadata:
labels:
component: backend
instance: app
name: containers-my-app
spec:
containers:
- name: app
image: ghcr.io/camptocamp/course_docker_backend:python
ports:
- containerPort: 8080
name: webappAs defined in the Deployment’s
spec.template.metadata.labels field, Pods will have the following labels: component: backendinstance: appname: containers-my-appThe Service has a selector that matches labels of the Pod. Therefore the Service will load balance traffic to Pods deployed by the Deployment.
ServiceMonitor objects also use a selector to discover which Services need to be monitored. Prometheus will scrape metrics from every Pods behind selected Services.
For example, to retrieve metrics from our Pods, we can deploy the following ServiceMonitor object:
apiVersion: monitoring.coreos.com/v1
kind: ServiceMonitor
metadata:
  name: webapp
  labels:
    component: backend
    instance: app
    name: containers-my-app
    release: prom
  namespace: my-app
spec:
  namespaceSelector:
    matchNames:
    - my-app
  selector:
    matchLabels:
      component: backend
      instance: app
      name: containers-my-app
  endpoints:
  - port: http
Prometheus Operator will search for Services:
my-app namespace,component: backendinstance: appname: containers-my-app
http
It will then use the Service selector to find Pods. As a result, one target per Pod will be created in the Prometheus configuration.
PodMonitor objects use a selector to find Pods directly. No Service needs to be deployed.
For our Pods, we can use the following PodMonitor:
apiVersion: monitoring.coreos.com/v1
kind: PodMonitor
metadata:
  name: webapp
  labels:
    acomponent: backend
    instance: app
    name: containers-my-app
    release: prom
  namespace: my-app
spec:
  namespaceSelector:
    matchNames:
    - my-app
  selector:
    matchLabels:
      component: backend
      instance: app
      name: containers-my-app
  podMetricsEndpoints:
  - port: webapp
The Prometheus operator will search for Pods:
my-app namespace,component: backendinstance: appname: containers-my-app
webapp
For each Pod, a new target will be added to the Prometheus configuration.
Gathering and storing metrics is very useful to investigate when something goes wrong. But there are often some modifications of one or a combination of metrics before a service becomes completely unusable.
A common example of this is remaining free disk space. Fixing hard thresholds with arbitrary values on disk space is usually inefficient (you might actually end up with 95%, 100% and 101% thresholds). What needs to be monitored is actually the estimated time left until the disk is full, which can be obtained by running a time regression on the metric.
Some other examples:
This is the purpose of alerts: when such events are detected, the system notifies the right person, allowing you to keep your eyes off dashboards.
After investigating and finding the root cause, you should always ask yourself if you can build an alert to detect such a case. There is also the possibility of increasing the observability if some metrics are missing.
The Prometheus Operator allows the definition of alerts with a custom Kubernetes object: PrometheusRule
In this custom resource, you can define multiple alerts:
apiVersion: monitoring.coreos.com/v1
kind: PrometheusRule
metadata:
  name: webapp
  namespace: my-app
  labels:
    component: backend
    instance: app
    name: containers-my-app
    app: kube-prometheus-stack
    release: prom
spec:
  groups:
    - name: app
      rules:
        - alert: NoProductViewSince1h
          expr: (view_total - view_total offset 1h) < 1
          for: 5m
          labels:
            severity: Critical
In the example above, only one alert is defined.
Find below what needs to be defined for usual cases for each alert:
alert: the alert nameexpr: a PromQL expression that triggers an alert if it returns something. This is why most of the time a threshold is used. With the offset function we compute the views from the past hour, if the result is above the threshold 1, then an alert is created and pushed to AlertManager.labels: a set of labels, usually used for alert severityfor: delays triggering the alert. The PromQL expression must return some sample during the duration of the field for, before an alert is triggered.There are many selectors involved in this process:
There are also selectors to discover ServiceMonitor, PodMonitor, and PrometheusRule objects. Those selectors are defined in the Prometheus object using the following fields:
spec.serviceMonitorSelectorspec.serviceMonitorNamespaceSelector
spec.podMonitorSelectorspec.podMonitorNamespaceSelector
spec.ruleSelectorspec.ruleNamespaceSelector
If the target is not discovered by Prometheus:
In order to check a label selector, you can use the
-l option of kubectl. For example, to check the following selector in a ServiceMonitor:selector:
matchLabels:
component: backend
instance: app
name: containers-my-apprun the following command:
kubectl -l component=backend,instance=app,name=containers-my-app get serviceServiceMonitor references either an incoming port defined in the Service or a Pod port:
ServiceMonitor.spec.endpoints.port references the name of a Service port: Service.spec.ports.name ServiceMonitor.spec.endpoints.targetPort references a Pod port: Pod.spec.containers.ports.containerPort or Pod.spec.containers.ports.name PodMonitor references port defined on Pod:
PodMonitor.spec.podMetricsEndpoints.port reference the name of a Pod port: Pod.spec.containers.ports.name
Note that Prometheus will only use Pods with a Ready state.
Grafana includes an auto discovery mechanism for dashboards. Any ConfigMap with a label
grafana_dashboard=1 is loaded into Grafana.The following ConfigMap will create a minimal dashboard in Grafana. Note that this ConfigMap needs to be deployed in the same Namespace as Grafana.
kind: ConfigMap
apiVersion: v1
metadata:
  name: my-dashboard
  labels:
    grafana_dashboard: "1"
data:
  dashboard.json: |
    { "title": "Product Views",
      "time": { "from": "now-6h", "to": "now" },
      "editable": false,
      "panels": [ {
          "gridPos": { "h": 9, "w": 12, "x": 0, "y": 0 },
          "id": 2,
          "targets": [ {
              "exemplar": true,
              "expr": "rate(view_total[2m])",
              "interval": "",
              "legendFormat": "{{product}}",
              "refId": "A"
            } ],
          "title": "Product View",
          "type": "timeseries"
        }
      ]
}Including monitoring objects in Application Helm Charts is a good way to maintain the observability layer of an application. The monitoring components can be versioned with application packaging. Also the deployment of monitoring can follow the same workflow as the application.
I will not explain how to package an application, but I’ll demonstrate how to include the following elements:
In the chart’s
values.yaml, add a new section for monitoring:monitoring:
alerts: true
dashboard: trueThe
monitoring.alerts values controls the deployment of the PrometheusRule object. The deployment of the ConfigMap for the dashboard is controlled by monitoring.dashboard.For the PodMonitor or ServiceMonitor objects, we can check if the Prometheus Operator is installed using the .Capabilities.APIVersions.Has function:
{{- if .Capabilities.APIVersions.Has "servicemonitor.monitoring.coreos.com/v1" }}
apiVersion: monitoring.coreos.com/v1
kind: ServiceMonitor
...
{{- end }}
Additionally, for alerts and dashboards, we can check the "values" set on the Helm release:
{{- if .Capabilities.APIVersions.Has "prometheusrule.monitoring.coreos.com/v1" }}
{{- if .Values.monitoring.alerts }}
apiVersion: monitoring.coreos.com/v1
kind: PrometheusRule
...
{{- end }}
{{- end }}
A common workflow to maintain a dashboard is to:
⚠ If the JSON representation of the dashboard is stored in the ConfigMap code, you will have to indent the content properly:
kind: ConfigMap
apiVersion: v1
metadata:
  name: my-dashboard
  labels:
    grafana_dashboard: "1"
data:
  dashboard.json: |
    { "title": "Product Views",
      "time": { "from": "now-6h", "to": "now" },
      "editable": false,
      "panels": [ {
          "gridPos": { "h": 9, "w": 12, "x": 0, "y": 0 },
          "id": 2,
          "targets": [ {
              "exemplar": true,
              "expr": "rate(view_total[2m])",
              "interval": "",
              "legendFormat": "{{product}}",
              "refId": "A"
            } ],
          "title": "Product View",
          "type": "timeseries"
        }
      ]
    }
It is generally easier to store the dashboard code in a dedicated file and then load the contents in the ConfigMap with some Helm templating functions:
{{- if .Capabilities.APIVersions.Has "prometheusrule.monitoring.coreos.com/v1" }}
{{- if .Values.monitoring.dashboard }}
apiVersion: v1
kind: ConfigMap
…
data:
  dashboard.json: |
    {{- .Files.Get "dashboard.json" | trim | nindent 4 }}
{{- end }}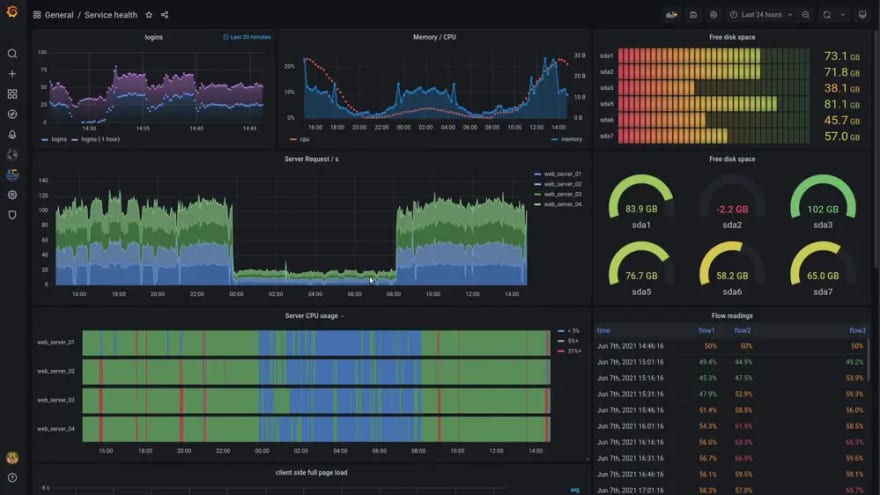
{{- end }}Deploying monitoring stacks —Prometheus, Grafana, AlertManager, ElasticSearch, Loki, …— provides much more observability in a project, but at the cost of consuming more resources. Developers not using these features is a waste of resources. The project also has poor observability because only system metrics and maybe http metrics are retrieved. Adding application specific metrics and even business metrics allows you to build beautiful dashboards with colors and graphs that are very fun to report during boring review meetings.
37