
50
Real-life performance comparison of MongoDB Atlas on Azure vs GCP
TLDR; MongoDB Atlas M20-M40 on Azure and GCP perform pretty similar, with Azure seemingly a bit faster (surprise!) and GCP seemingly a bit more stable (less outliers).
The intention of this post is to compare the real-life performance of MongoDB M20-M40 running on Azure and GCP. Read further if you want to get the condensed results of otherwise a multi-day/week exercise1.
The trigger for the load tests were various disk-related performance issues on Azure and repeated statements that MongoDB on AWS and GCP is running much better.
Important Notes:
- This post is discussing only small instances - M10-M30 with 128 and 256 GB storage only (no need for/experience with bigger ones yet)
- This is not a "scientific" or properly done benchmark (I am an amateur performance/load tester). If you see the approach is wrong or/and can be improved - please let me know in the comments what I can do better (appreciated).
- The architecture details of the software under test is out of scope for this article (I may or may not write another one on that). Same for the load test automation tooling, which is basically implemented using Azure DevOps Pipelines and a substantial number of bash scripts.
- Even though many load tests with different requests per second were performed, only the result of a subset of the tests - 50 requests per second - will be used in this article, as these are enough to illustrate the differences in performance of MongoDB Atlas on Azure/GCP.
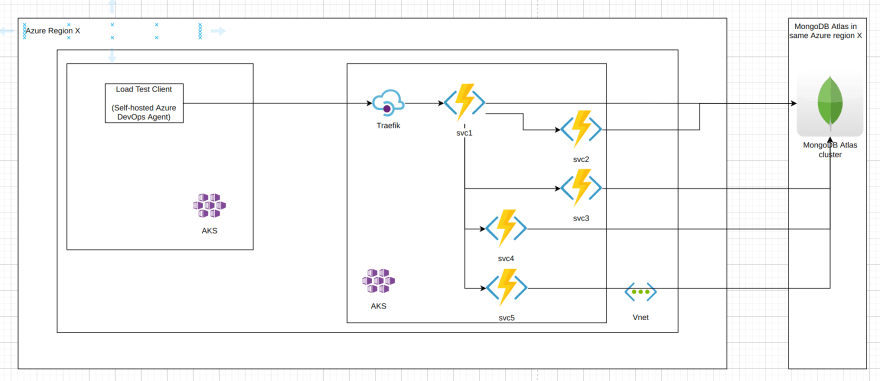
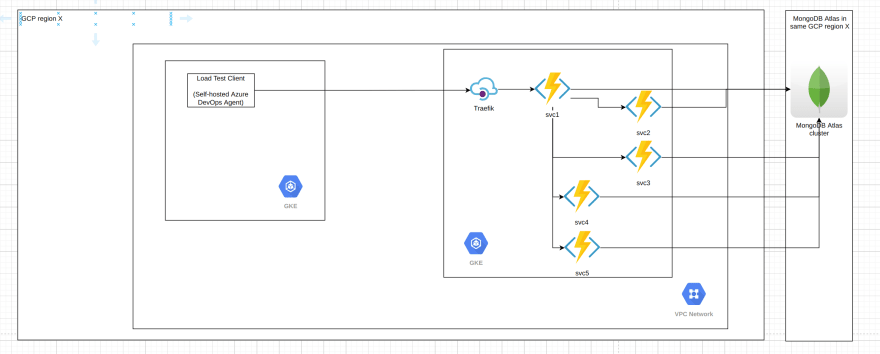
The software under test is a set of 5 microservices responsible for synchronously2 processing a business operation/transaction 3. The overall interaction between the services looks like this (anonymized):

Note that all database operations are single-document ones where the document size is less than 1 KB, and fall into 3 categories:
1) find a single document by UUID id (primary key)
2) insert a single document
3) replace a single document
The load test infrastructure involves the following tools:
- Azure DevOps Pipelines - for running bash scripts in sequence, responsible for both setup, running the load tests and tear down of the load test environment (both Azure and GCP)
- NBomber - a load test client, generating in this case 50 requests per second using InjectPerSec(rate = 50, during = seconds 600) Load Simulation
- "Client" Kubernetes cluster (AKS or GKE) with just 1 node (4 vCPUs, 8Gb RAM) for hosting the Azure DevOps self-hosted pool with 1 agent running NBomber
- "Server" Kubernetes cluster (AKS or GKE) with 2 nodes (2 vCPUs, 16 GB RAM) for running the microservices (3/5 microservices configured with 2 replicas, 2/5 with 1 replica only). Traefik is running as well in the "server" cluster to act as an (HTTPs) API Gateway.
- Both K8s clusters are in the same region, Vnet/VCP Network, different subnets, however the client clusters uses HTTPs with the public DNS hostname of the server for making the calls (so certain traversal of the network infrastructure of the cloud provider takes place, however we are speaking about single-digit ms here).
The MongoDB instances used are summarized in the following table:
TABLE MongoDB Instances, including IOPS and $$$
| Cloud | Instance Type | Storage Size (GB) | vCPUs | RAM | IOPS | $$$/h | $$$/month |
|---|---|---|---|---|---|---|---|
| Azure | M20 | 128 | 24 | 4 | 500 | 0.34 | 245 |
| GCP | M20 | 128 | 1 | 3.75 | 76805 | 0.33 | 238 |
| Azure | M20 | 256 | 24 | 4 | 1100 | 0.45 | 324 |
| GCP | M20 | 256 | 1 | 3.75 | 150005 | 0.45 | 324 |
| Azure | M30 | 128 | 2 | 8 | 500 | 0.80 | 576 |
| GCP | M30 | 128 | 2 | 7.5 | 76805 | 0.60 | 432 |
| Azure | M30 | 256 | 2 | 8 | 1100 | 0.91 | 655 |
| GCP | M30 | 256 | 2 | 7.5 | 150005 | 0.72 | 518 |
| Azure | M40 | 128 | 4 | 16 | 500 | 1.46 | 1051 |
| GCP | M40 | 128 | 4 | 15 | 76805 | 1.06 | 763 |
Worth noting:
- Azure M20 has 2 CPUs vs 1 vCPU for GCP M20, however in case of Azure the vCPU are burstable, whereas in GCP the single vCPU can be utilized to 100% all the time.
- There is a huge difference in IOPS (on paper) with GCP offering 14-30x more IOPS than Azure for the same storage size!
- With bigger instance sizes Azure becomes noticeably more expensive.
The following sections will present the load testing results from different perspectives.


Interpretation:
- In the 1-minute test executions Azure M20 is clearly faster than GCP M20
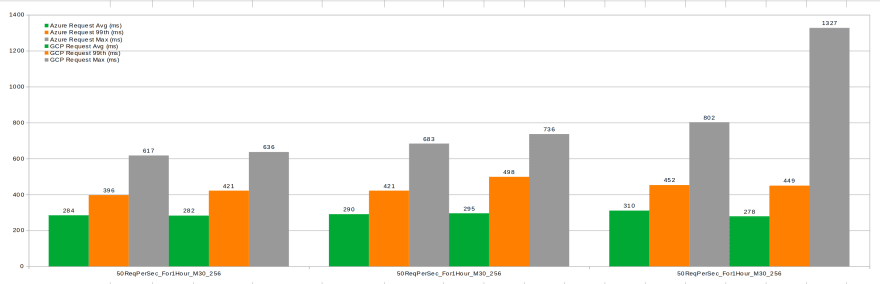
- In the 1-hour test executions Azure M20 is faster than GCP when it comes to average durations, 99th percentiles are almost equal, however the maximal durations for Azure are worse than GCP's.


Interpretation:
- In the 1-minute test executions Azure M20 is again clearly faster than GCP M20
- In the 1-hour test executions Azure M20 is faster than GCP when it comes to average durations, but has slightly slower 99th percentiles and maximal durations.


Interpretation:
- In the 1-minute test executions Azure M30 is faster than GCP M20
- In the 1-hour test executions Azure M30 is at the same level as GCP when it comes to average durations, 99th percentiles are almost equal, with the maximal durations for Azure better than GCP's.
Interpretation:
- In the 1-hour test executions Azure M30 is at the same level as GCP when it comes to average durations, 99th percentiles are almost equal, with the maximal durations for Azure better than GCP's.

Interpretation:
- In the 1-minute test executions Azure M40 is at the same level as GCP (however the latter is substantially cheaper, see table above)

Interpretation:
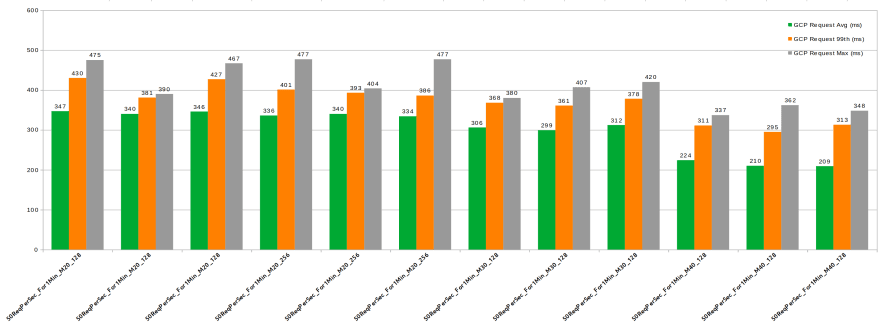
- Azure average durations do not improve substantially with the increase of the instance/storage size
- Azure 99 percentile and max durations improve significantly with the increase of the instance/storage size (variability decreases, less outliers)
- GCP averages improve slightly with the instance/storage size. Same is valid for 99 percentile and max durations.
- Overall it seems Azure has better averages with smaller instance/storage sizes, however GCP has lower duration variability/less outliers. Things become more equal with bigger instance/storage sizes.
There are a few hypotheses as to why the results could be incorrect:
Hypothesis 1: Burstability of M20 on Azure might lead to good results in shorter test durations, and worse results in longer ones
Hypothesis 2: There is another bottleneck in the load test infrastructure (K8s node utilization checked)
As stated above, overall it seems Azure has better averages with smaller instance/storage sizes, however GCP has lower duration variability/less outliers. Things become more equal with bigger instance/storage sizes. Having in mind that the costs have opposite dynamics - GCP gets substantially cheaper with bigger instance/storage sizes, it seems that GCP is a winner in the M30/M40 range. However, if M20 better suits your needs (as in my case), then Azure seems to have almost the same costs as GCP but better performance. Once again, beware of the various disk-related performance issues on Azure.
P.S. I would appreciate any comments pointing out an obvious mistake leading to wrong results!
-
Including the load test automation/setup itself ↩
-
Synchronous = Client calls via HTTPS/REST Service1, Service1 acts as an orchestrator and calls synchronously Service2, Service3 etc. and awaits (async) their responses. Some of the inter-microservice calls are done in sequence, and some in parallel. ↩
-
"Transaction" does not mean database transaction or distributed database transaction. No database transactions are used (no database was harmed ;) ↩
-
Burstable, which means from 2 x 100% = 200% only 40% are provisioned, but accumulated credits allow bursting up to the full 200% from time to time ↩
-
Half of the IOPS are read IOPS and half are write IOPS ↩
50