
27
MongoDB Atlas & Azure - a forced marriage?
TLDR; MongoDB Atlas on Azure (smaller instances with smaller storage) works but comes with a number of pitfalls you should be aware of. You'd save a lot of headaches hosting MongoDB Atlas on AWS/GCP instead.
The intention of this post is to point out a number of issues we have experienced over the past 2 years using MongoDB Atlas on Azure, having 2 main objectives in mind 1:
But you might ask immediately - why MongoDB Atlas on Azure instead of using the native CosmosDB? The reasons for us were:
Important Notes:
The following issues will be discussed in detail below:
Inadequate storage IOPS when using small storage sizes (< 512Gb) is the elephant in the room.
When starting with MongoDB Atlas on Azure one of the first important questions I had was - is the pricing similar to that for AWS/GCP, or is it higher (I have experienced quite a few Azure services incl. basic infrastructure ones are in reality more expensive than AWS/GCP ...). At a first glance I thought it's all relatively similar:
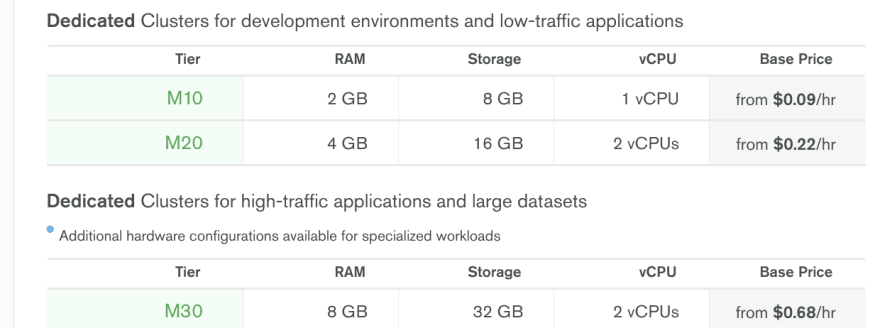
MongoDB Atlas Pricing on Azure Netherlands (westeurope), small instances:
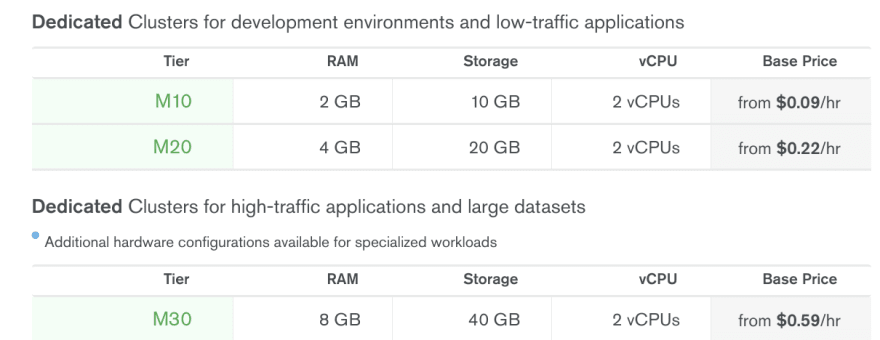
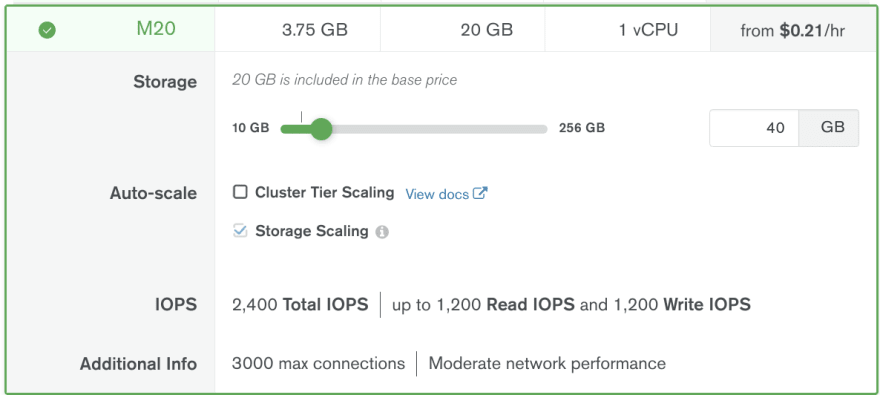
MongoDB Atlas Pricing on AWS Ireland (eu-west-1), small instances:
MongoDB Atlas Pricing on GCP Belgium (europe-west1), small instances:
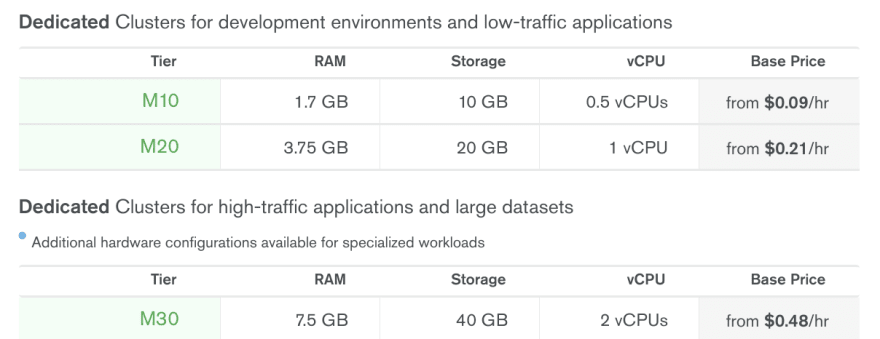
Yes, Azure is still the most expensive hosting for MongoDB, but the difference does not seem gigantic at a first glance ... This is until you expand the details for M20 for example and check the IOPS value in there:
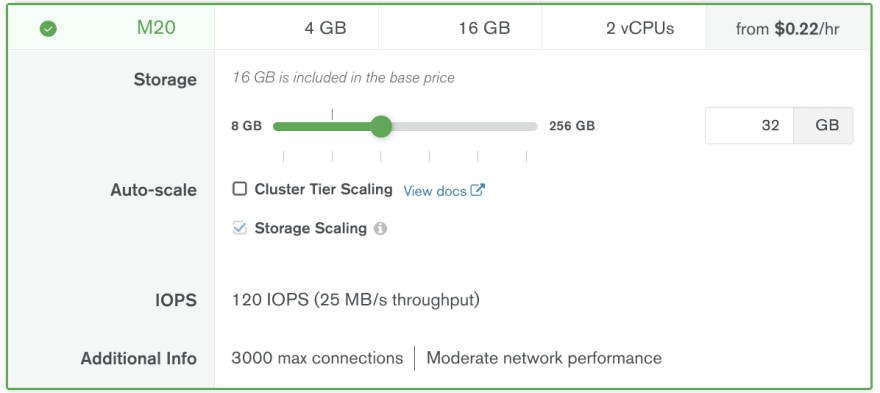
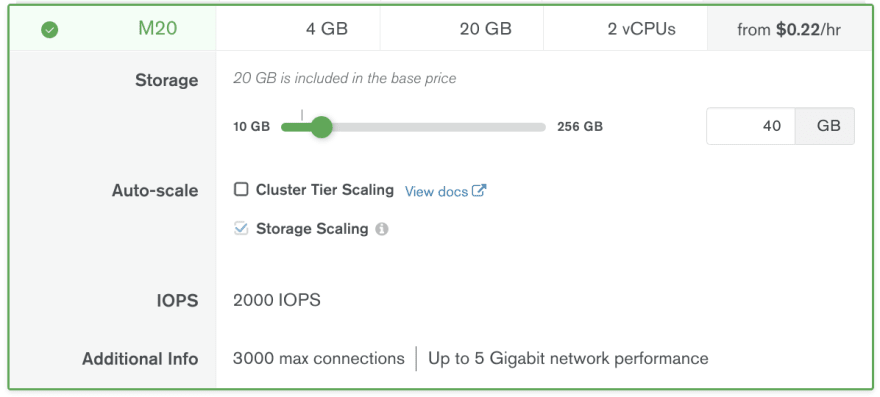
Did you notice the difference? Azure gives you only 120 IOPS for starters vs. 2000+ IOPS on AWS and GCP! And 120 IOPS do cause regular invisible in the metrics storage throttling, which results in (single document write) operations taking occasionally up to 2-3 seconds (usually 7-8ms with write concern majority)!!
What is the solution for Azure currently? Even if you do not need it, increase your storage to 128Gb (gives you 500 IOPS) or 256Gb (gives you 1100 IOPS - more is not possible on M20) but that of course increases dramatically the cost of M20 to $0,34/hour or $0,45/hour respectively ...
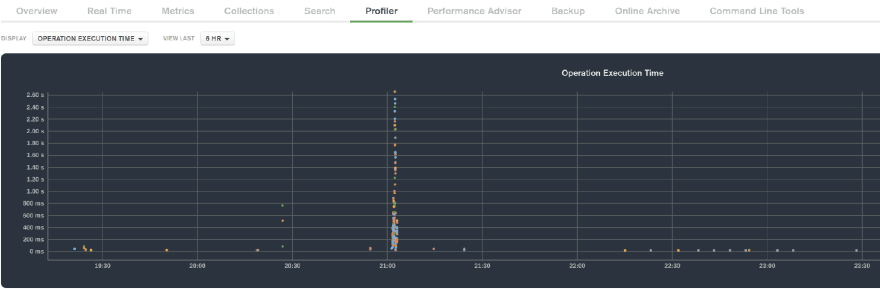
The story about low disk IOPS with small storage sizes does not end here though. The problem is made worse by having no way to see when the IOPS are throttled. This is how the Disk IOPS metric looks for the a M20 primary node:
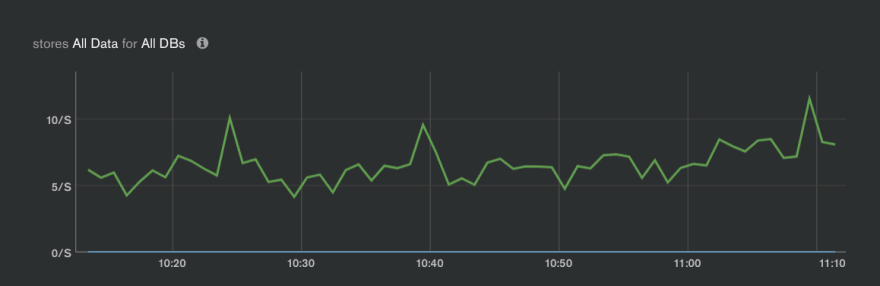
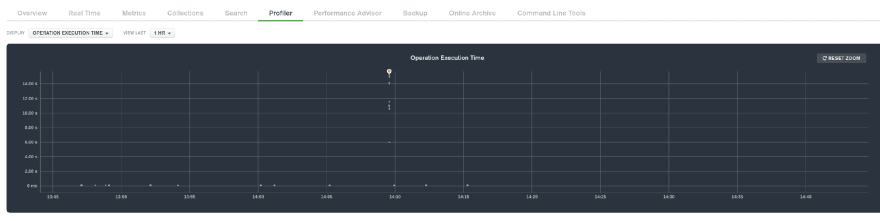
Doesn't the above graph give you the impression that not 120, but even 20 IOPS will be enough? Yes ... but actually not, and you may see in db logs or in the MongoDB Atlas Profiler (visual) the following or worse:
(UPDATE 8th Oct 2021) MongoDB have added Max Values for all hardware metrics (thanks @MongoDB Atlas Team!), so now you can see more clearly how the IOPS are fully utilized from time to time (for some yet
unknown reason):
unknown reason):
Important: Even with 128Gb (500 IOPS) and normal (=low) opcounters (no peaks!) we have experienced within 1 week 2 cases of single small document insert taking up to 7-15 seconds (yes, seconds!, instead of 6-8 ms in average) when something happens to the IOPS ..
After several km-long support cases based on scarce comments and internal metrics provided by MongoDB Support my conclusion is that IOPS limits are hit by the primary or secondary nodes when the write operation must be confirmed by primary + at least 1 secondary, and the secondary cannot confirm because the oplog has not been synced yet due to IOPS throttling.
(UPDATE 8th Oct 2021) Turns out all Azure Premium SSDs support bursting up to 3500 IOPS for up to 30 minutes (even confirmed by MongoDB Atlas Support Engineer!), but the $1mln question is then why, oh why, do we experience still these 7-15 seconds (not milliseconds) disk latency (insert of single small document, no db trx or anything) then??
Trying to find someone @MongoDB Atlas to access the underlying Azure VM Disk Metrics and check the values of the following ones, which can throw some light if burstable credits are exhausted from time to time (but I don't really believe that this is happening in our case ..):
(UPDATE 11th Oct 2021) Even after storage upgrade to 256Gb / 1100 IOPS still getting randomly hit by single-document insert/replace operations taking 100-200x more than usual, e.g. 1600+ ms instead of 6-8ms ... Happens couple of times per day when the load is relatively low - single-digit business operations per second, every business operation = about 10 single-document read/write db operations.
(UPDATE 4th Jan 2022) The last statement about the root cause of the intermittent disk latency issues is that the regular 15-minute Ansible monitoring/management scripts hit hard the OS Disk of the Standard_B2s VM (in case of M20) which causes a delayed (after about 7 minutes??) disk throttling affecting also the MongoDB process ...
M10 and M20 instances are using B-series Azure VMs (e.g. M20 is using
Standard_B2s). These are burstable VMs where you have for Standard_B2s 40% CPU baseline performance guaranteed (40% = 2 vCPUs * 20% CPU utilization each). If you use less than 40% you accumulate credits and every credit gives you the right to burst above the 40% (e.g. to 100% = 1 vCPU fully utilized or 200% = both vCPUs fully utilized) for certain period of time until credits reach 0. There is a CPU Steal % metric in MongoDB Atlas which should be 0 if all good, and should start increasing in case you need more CPU but you cannot get it because you are throttled to your baseline performance (= no available credits for bursting). An alert can be configured once this metric reaches certain threshold (e.g. above 0 for several minutes) ...
That is all fine and good, but the problem is that MongoDB Atlas seems to have implemented the CPU Steal % metric/alert only for AWS ... so in Azure there is no way to detect and alert such an important situation ...
While testing different combinations of instance size (e.g. M20, M30) and storage size (16, 64, 128Gb) we had to downgrade the storage a couple of times (e.g. from 128 back to 16Gb). Usually upgrade operations worked flawlessly - MongoDB Atlas takes one node after the other offline, replaces, syncs with primary and puts back in cluster, no data loss. In case of storage downgrade we lost all the data in the Oplog, which is of critical importance for our application built on top of MongoDB Change Streams for all the async event publishing functionality. This means our K8s pods waiting for change events lost their resume tokens (saved checkpoints) as the latter were pointing to non-existent oplog positions ...
According to MongoDB this happens when
and I have the feeling the above is again Azure-specific. My request for changing that behavior on Azure has not been honoured yet.
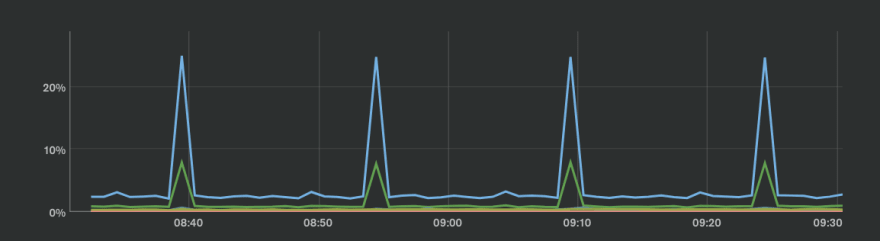
While testing with different instance and storage sizes I noticed that in a standard 3-node cluster I get different average business operation (1 business operation contains 2-3 single document
find and 7-8 modify operations) processing times depending on which node is primary:2nd Node is Primary:

3rd Node is Primary:

You see 15-20ms difference in average times, meaning up to 25%, which is huge! My suspicion is that this is because of some networking overhead due to putting the different nodes in different Availability Zones, however my client applications are running on 3 Kubernetes nodes split in the same way to the 3 different Azure Availability as the MongoDB nodes ... Wouldn't be surprised if this is another Azure idiosyncrasy ...
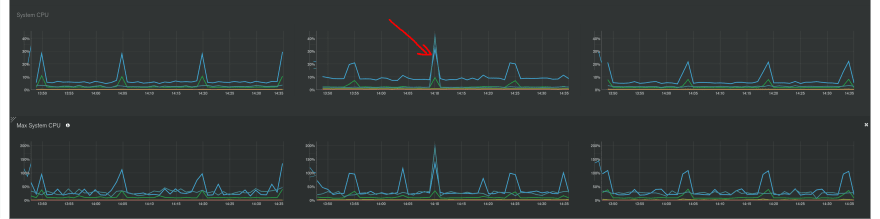
This is how the CPU looks like on all of our M20 clusters:
What are these regular CPU spikes every 15 minutes you might ask - is there some heavy regular application activity? The answer is no, our application is not doing anything, however there is some MongoDB Atlas Monitoring cron job (aka "Chef scripts") which is doing some heavy work every 15 minutes. Remember: M20 is a burstable instance with baseline of 40%, so every 15 minutes this monitoring process is "stealing" 1-2 minutes of CPU, for which you have paid ...
I had a couple of tickets with MongoDB Support on this topic suspecting that this is the reason for the randomly slow operation processing times, not clear if it is correlated or not (several disk latency occurrences happened at the same time, but a few also not), however it still feels like unoptimized admin intervention ...
I had a couple of tickets with MongoDB Support on this topic suspecting that this is the reason for the randomly slow operation processing times, not clear if it is correlated or not (several disk latency occurrences happened at the same time, but a few also not), however it still feels like unoptimized admin intervention ...
With MongoDB Azure we were suffering for more than 6-months from downtimes (applications could not connect anymore to the cluster and needed to be manually restarted!) during cluster maintenances. This happened exactly at the point of time when the 3rd node was getting replaced (all fine with 1st and 2nd).
It took tons of discussions (incl. with an Account Manager) and paying for Professional Services until this problem was fixed in the .NET Driver, but only after another big customer complained.
It took tons of discussions (incl. with an Account Manager) and paying for Professional Services until this problem was fixed in the .NET Driver, but only after another big customer complained.
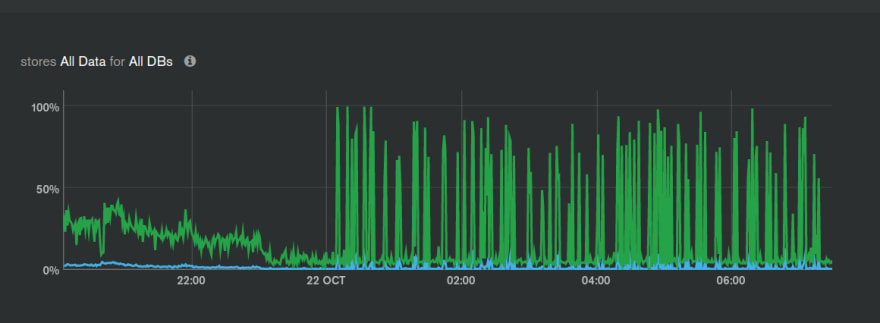
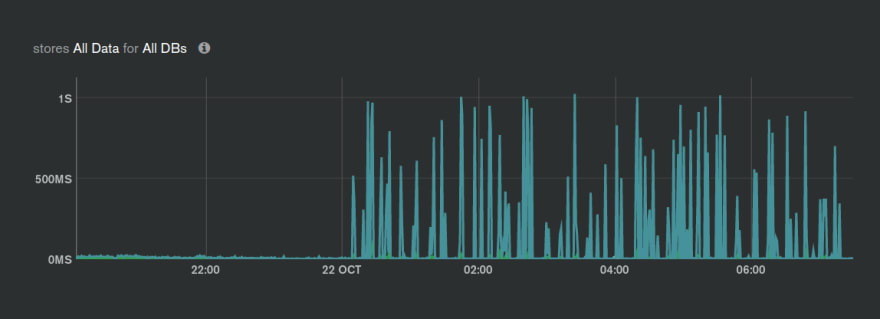
For a week now we are experiencing random node failovers. Activity Feed in Atlas Portal shows only this:
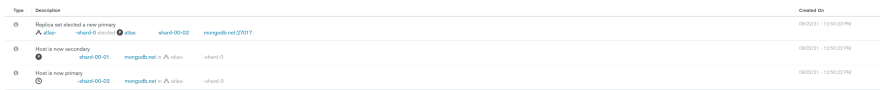
The current explanation by MongoDB Support (as far as I have understood it) is that there are network issues between the nodes and a node triggers re-election. But how come one of the most stable cloud components (network) is having so many outages, and what is the resolution? No answer yet ...
The current explanation by MongoDB Support (as far as I have understood it) is that there are network issues between the nodes and a node triggers re-election. But how come one of the most stable cloud components (network) is having so many outages, and what is the resolution? No answer yet ...
(Update 8 Oct 2021): After MongoDB Atlas Support talked to Azure Support network reconfiguration was performed. Since then we have not experienced additional unexpected failovers, so (assuming this has been integrated in the setup scripts for new MongoDB Atlas clusters on Azure) the problem can be treated as resolved.
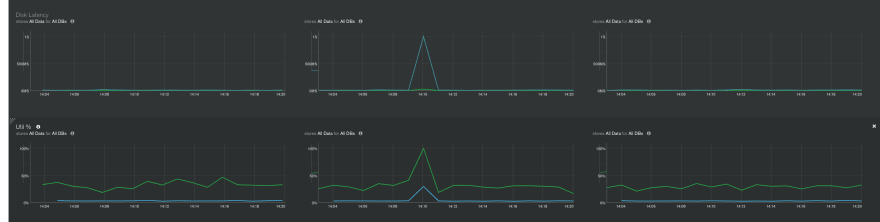
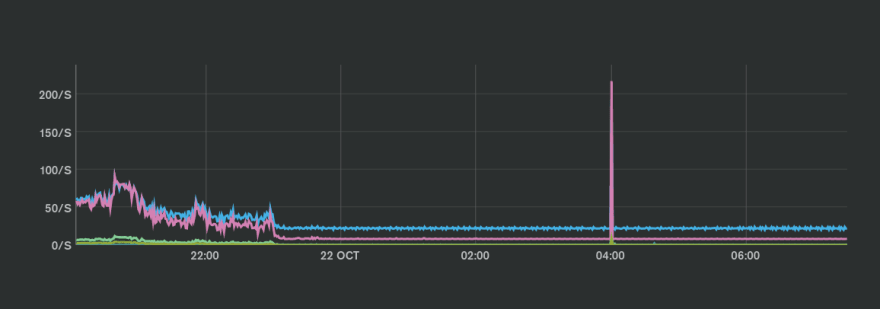
Another case from past week - the primary node just "stalled" or froze for 45 seconds, and then continued working. Of course, during that time all business operations were affected, and some of them timed out. According to MongoDB Support something happened to the node's disk - it just physically stopped working. What can be done so that this does not happen again? Nothing ... if it happens again the node can be replaced ...
And another case of 3 seconds disk "stalling" or whatever - disk queue went up, db operations got 100 slower:
Was this due to exceeding Disk IOPS and being throttled by Azure Storage - if the metric is to be believed (and I don't) - No ..:
I understand, that cloud VMs may go away or freeze in case the host crashes, but somehow too many strange things happen lately with our MongoDB Atlas clusters on Azure - can Azure be that unstable??
A picture is worth a thousand words:
Disk Utilization % - from all processes running on the node
Disk Latency
Opcounters - absolutely no load ...
Happens already for the 2nd time in the past few days, the solution last time was to fail over manually to another node, and wait 30-45 minutes (!??!)
The astute reader may have already concluded from the above that the performance and stability of the M20 MongoDB Atlas instance on Azure is a joke, and this due to disk-related issues.
As recommended multiple times by MongoDB Support and Account Management, MongoDB Atlas should rather be used in conjunction with hosting on AWS/GCP where it seems to be much more stable, fast and also cheap.
This is something that was not crystal-clear to me when I decided for Azure and implemented the rest of the infrastructure there. Also a quick look at the different MongoDB Atlas hosting options did not explicitly warn me that one gets much less IOPS and a bunch of additional problems on Azure.
If CosmosDB didn't have some of the issues (bloated/expensive storage, lack of atomic update, enforced partitioning from the start, etc.) we would have moved to it long ago. Migration to GCP/AWS is something I will be actively investigating, however there are some goodies we are using (AKS, App Insights, Azure Data Explorer/Kusto) which need more work.
I have read that Azure has a weak offering of low-level IaaS, but why it is so lagging behind AWS/GCP when it comes to IOPS for smaller disks is beyond my understanding (read about the software layer they have put on top of it, but I don't care). Or rather - I cannot wrap my head around the question why Azure is not working day and night to fix this big gap in such an important fundamental/enabling service.
I wish Azure could fix this and additionally expose CPU Steal % and other metrics, so that MongoDB Atlas could level up its Azure hosting. I wish additionally that MongoDB Atlas could invest a little bit more in its Azure hosting (15 minutes heavy cron jobs can be optimized, additional metrics can be added even with the current Azure API I guess). But I have learnt the hard way that such wishes usually end up sitting in glorious Product Feedback Lists for ages ...
Have you experienced similar issues like the above? Or have you found other solutions? Would be happy to get such input from other Azure MongoDB Atlas customers!
P.S. Please vote for the following MongoDB feedback ideas:
OK, you got me, additionally I have a secret hope that if someone from MongoDB Atlas and Azure reads this (s)he might trigger some internal improvement ... but realistically this never works that way, we all know that :( ↩
27