
22
Top 3 tools for monitoring Python in AWS Lambda
Comparison of top observability and debugging tools to help you monitor Python in AWS Lambda.
Serverless architectures, comprised of lambda functions, are an extension of the principles of the service-oriented architectures, which popularized the approach where services communicate using messages or events. If implemented correctly, serverless architectures can reduce code complexity and easier manage the application.
FaaS solves many problems that the previous architectural models had to cope with. From a developer's point of view, the most critical aspect is that you just run your code without bothering with server administration, scalability, and availability. On the other side, some factors have to be dealt with differently than before.
One of these aspects is logging.
The old tools used for logging (daemons) are no longer an option since there is no "server" in the traditional sense. Also, since the actual infrastructure is abstracted, you don't have access to system-level metrics like RAM, CPU, or disk usage.
However, the requirements for a sound logging system are pretty much the same:
Maybe you are asking yourself why you should monitor your Lambda Functions. Well... there are two equally important reasons to do it. First, if you are reading this, you probably know AWS is not a free service, and every cent counts, especially when you are trying to start your new business. Second, customers are demanding and expect nothing but the best in terms of responsiveness. If an application fails to deliver on this, it will not make any difference in the design or how much marketing it gets; customers will go with the competition.
Let's start with what's already in the box.
The built-in tool for Lambda, CloudWatch, organizes logs based on function, version, and containers while Lambda adds metadata for each invocation. In addition, runtime and container errors are included in the logs. CloudWatch provides two methods to write a log entry:
print statements:
print('You will see this in CloudWatch')
logger functions available through the logging module:
logger.info('You will also see this in CloudWatch')
Amazon advises developers to use the logger function to get the additional info available like log levels, timestamps, and so on. When you start building your first FaaS application, chances are you will begin using CloudWatch. Logging will likely be the most used feature. CloudWatch will let you track issues, and for some time, you will rely on it. However, as your applications become more complex and eventually make it into production, you will become aware of their drawbacks. Fortunately, several tools can make your life easier. In this article, we'll have an in-depth look at the top 3.
The dashboard allows you to drill down to invocation level data and analyze each function individually. It is straightforward to use, and it provides all the information you can ask for intuitively.
Dashbird provides detailed views for:
Suppose your application logic is distributed over large amounts of functions. In that case, it makes more sense to collect info from the logs rather than sending telemetry at the execution time, which is precisely where Dashbird shines.
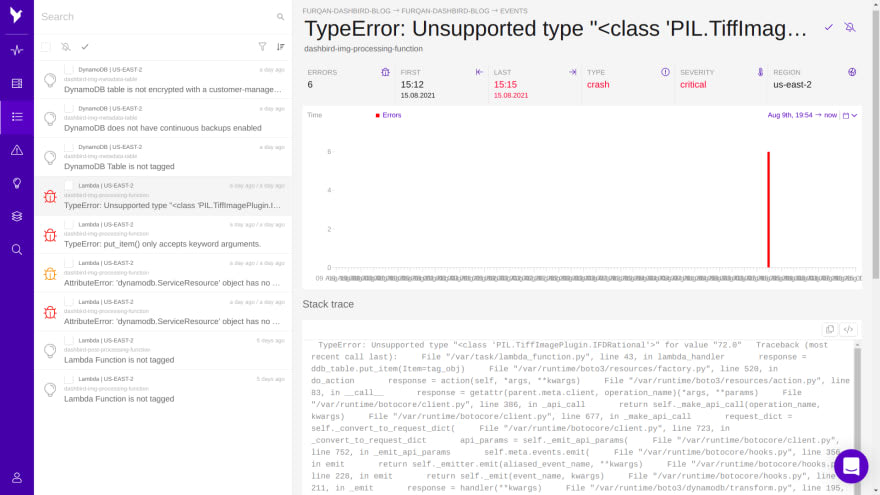
Dashbird includes a time-series view to provide developers with information regarding latency and memory usage. There are metrics available for invocation volumes, memory utilization, duration, and cost. Error handling is supported, and lots of details like stack traces, a list of affected invocations, logs for each invocation are collected and analyzed.
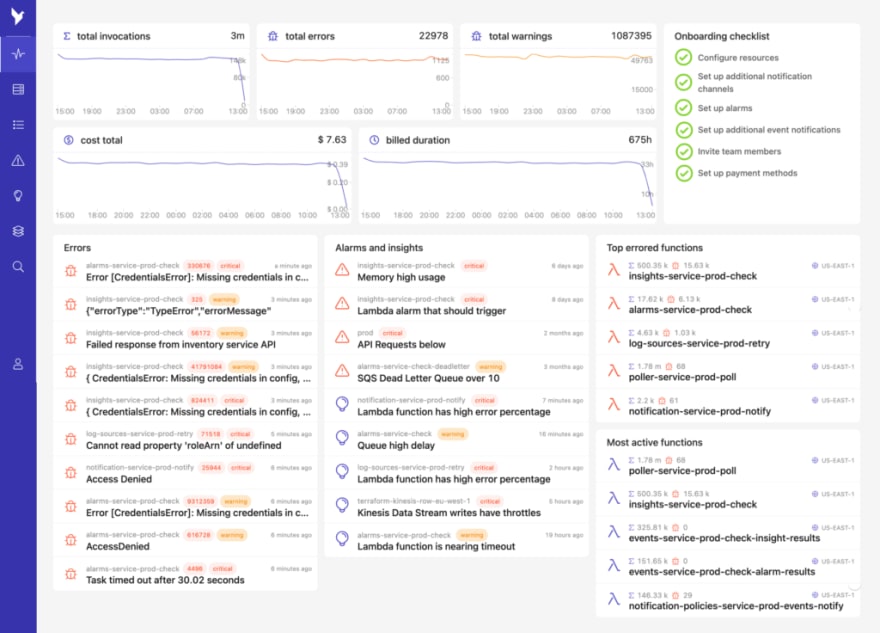
A nice feature baked in Dashbird is failure recognition in logs. Dashbird detects all types of failures for Python, Node.js, and Java. This includes crashes, early exits, timeouts, and configuration errors. Dashbird detects errors in your Lambda functions and alerts you via Slack or email. Each error contains detailed stack traces and logs linked to similar errors for more accessible debugging efforts.
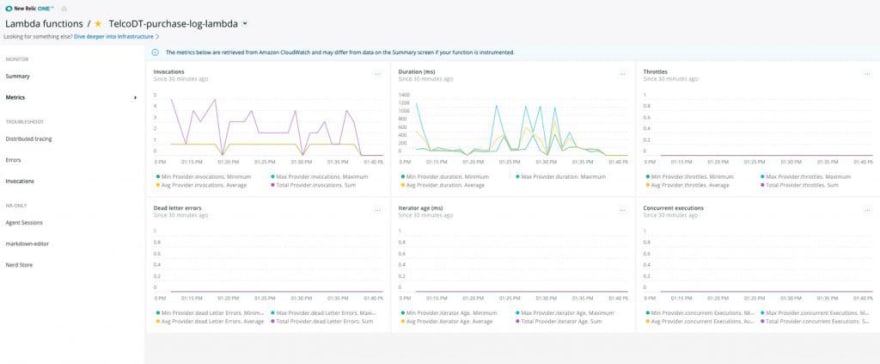
New Relic works by adding the New Relic Lambda extension to your Python functions. Once added, your functions will be instrumented and send their monitoring data to the New Relic service.
The New Relic Lambda layer will automatically catch, trace and raise any uncaught exceptions in your function.
New Relic provides support for reporting custom events:
@newrelic.agent.lambda_handler()
def handler(event, context):
newrelic.agent.record_custom_event(
"my_metric",
custom_event_object
)
New Relic is easy to start with; it's simple, and... it could be fun!
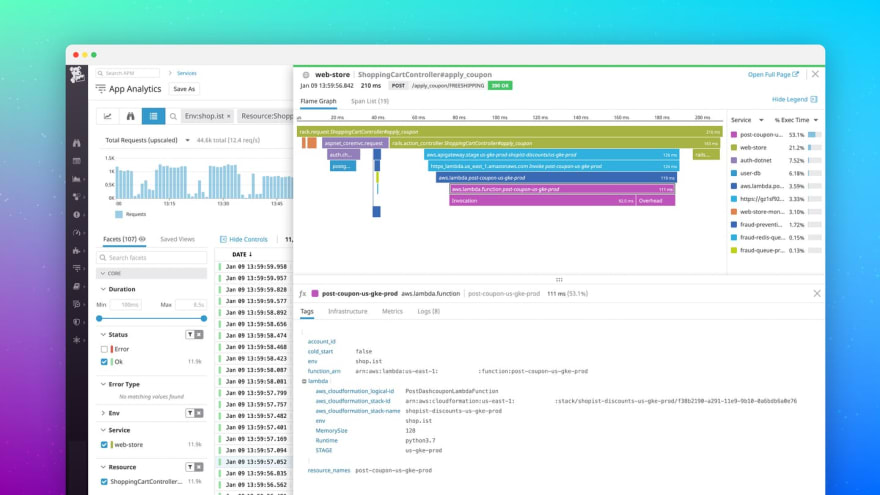
Datadog makes use of a helper function that lets the developer send custom metrics as pre-formatted log messages:
MONITORING|unix_epoch_timestamp|metric_value|metric_type|my.metric.name|#tag1:value,tag2
There is no overhead or latency experienced by end-user since data collection works in the background, and it allows correlation between Lambda metrics and other operational data, providing context.
There are several metrics available out-of-the-box for function's execution:
Datadog defines the following metric types that can be used:
Additionally, Datadog allows developers to define their custom metrics by printing out the Lambda functions following its predefined format. Alerting Once metrics are collected from the Lambda functions, Datadog can send alerts using the most popular communication tools like Slack or OpsGenie. An exciting feature of Datadog is their machine learning algorithms which can provide signals for events like an outlier or anomaly detection.
You have to pay a small price to fully enjoy the benefits of Lambda functions: abstraction, parallel execution, and high scalability. You must learn and use the new approach to monitoring serverless architectures. FaaS doesn't provide metrics in the traditional sense but, with a proper understanding of the AWS infrastructure, you can achieve a great level of observability for your lambda functions.
Further reading:
22