
32
Cascade of doom: JIT, and how a Postgres update led to 70% failure on a critical national service
The UK coronavirus dashboard is the primary data reporting service for the COVID-19 pandemic in the United Kingdom. It sustains on average 45 to 50 million hits a day, and is regarded as a critical national service.
We run the service on an active-active architecture, meaning that there are at least two, often three independent replicas of our services running in geographically different locations.
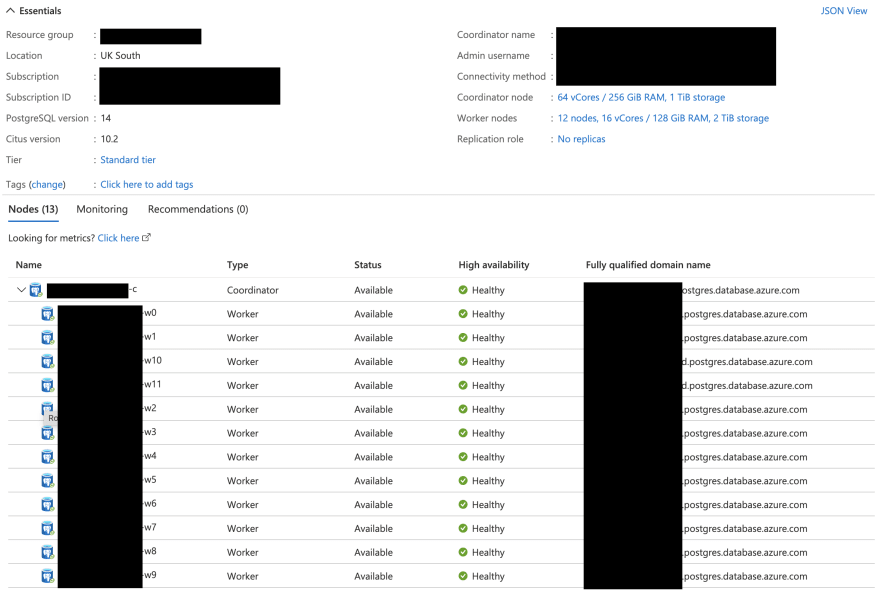
There is only one exception: our database. The service runs using a special PostgreSQL database: Hyperscale Citus. The fact that our database does not conform to the active-active architecture is not because we don't know how to create read replicas, rather, it is due to some logistical reasons beyond the scope of this article.
The database, however, runs on a highly available ecosystem, wherein an unhealthy instance is replaced within a couple of minutes.
We were quite excited about that, though because we use a fully managed service, we thought it was very unlikely for us to be able to upgrade our database until mid-2022 at the earliest.
Thanks to the great work done by the Azure Postgres team, however, our perception was proven wrong and the new update was made available on managed databases across Azure within 24 hours.
This was a great achievement for the Azure Postgres team — a new milestone in the maintenance of managed services in the Cloud. The update was made even more exciting as it also offered a new version of the plugin: Citus 10, which resolved a number of bugs we had encountered in the previous version.
Collaborating with the Azure Postgres (Citus) team, we deployed the new version in our development environment in the evening of Wednesday, 13 October 2021. It went very smoothly and we monitored everything for 48 hours and did some load testing before setting off the deployment to the production environment at midnight of Saturday, 16 October 2021. The deployment processes ended at around 11am on Saturday without any issues.
Everything was nice and rosey.
The week that followed the update saw a number of changes to the service:
The second update was intended to:
Towards the end of the week, several people reached out to me on Twitter reporting that they were encountering an increasing number of failed requests when using APIv2.
They were peculiarly saying that they couldn't download new data from the API after the release — i.e. at 4pm UK time.
My first course of action in response to such reports is to check the API service, and our PGBouncer instances to ensure that they are healthy. Then I usually clear the storage cache for APIv2, which usually resolves the problem.
Number of grievances directed at me on Twitter increased. People were now reporting increased latency in our Generic API. This concerned me because unlike APIv2, which is aggressively throttled and is designed to download very large payloads, the Generic API has been implemented in the Go programming language using highly optimised queries for rapid response. Whilst a download from APIv2 may take 3 or 4 minutes to complete, the average latency for our Generic API is ~30-50 milliseconds.
Once again, I investigated the infrastructure and even reverted some changes to the Generic API to ensure that the issue wasn't from the recent — albeit minor — changes. It wasn't.
On Sunday, 31 October 2021, we experienced a critical failure: our ETL processes were failing — we couldn't deploy new data to the database. The reason? failure to establish or maintain connections with the database.
I highlighted earlier that all connections to our database go through a connection pool (PGBouncer), which is hosted on two powerful virtual machines with 64 GB memory and 16 CPU cores (Standard_D16_v4), maintained using Azure VM Scale Sets.
Well, in a nutshell, a database offers a limited number of concurrent connections. You can change or increase the number, but there is a trade-off.
The more connections you have, the more memory you use. In Postgres, each additional connection uses ~10 MB of memory. It also means that more concurrent processes can be initiated, which it turn need more resources to run.
Most connections to the database don't need to be maintained. You only need a connection to the database while you submit a query and await the response. However, applications tend to occupy connections forever.
PGBouncer, and connection pools in general, mitigate the situation by maintaining a predefined number of connections with the database (986 in our case) and providing short lived connections to client applications in return (5000 in our case). It then forwards requests from each client to an available connection to the database from its pool, and then routes the response to the requesting client. In short, our 986 connections become 5000.
How long is the connection between a client and PGBouncer is maintained? That depends on your settings, but in our case, it is maintained for one transaction.
I had also just enabled accelerated networking on PGBouncer instances, so there was no reason for them to fail — and yet, they were both showing as unhealthy.
The health check probe for PGBouncer instances is set to ping Postgres. This means that — other than running out of CPU / RAM — there is only one other issue that could make them unhealthy: failure of the database.
Naturally, the next thing I did was to check the database, and this is what I saw:
Everything was healthy 🤯!
But this could not have been, and I needed to dig deeper. The only problem was that it was now 12:45pm, and we hadn't deployed any data yet. We were running out of time...
Next, I checked the number of connections:
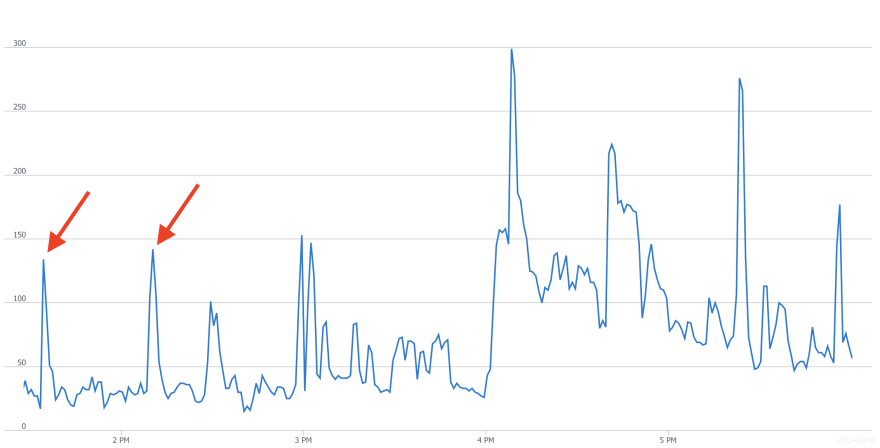
Ok, so nothing wrong there... except for the spikes highlighted using red arrows. They correlated with our failed attempts to deploy the data. This was weird as we don't normally need 150 connections to deploy the data. It gets done with 30 or 40 connections.
Next, I check the CPU... and that's when I learned the true meaning of Halloween 👻:
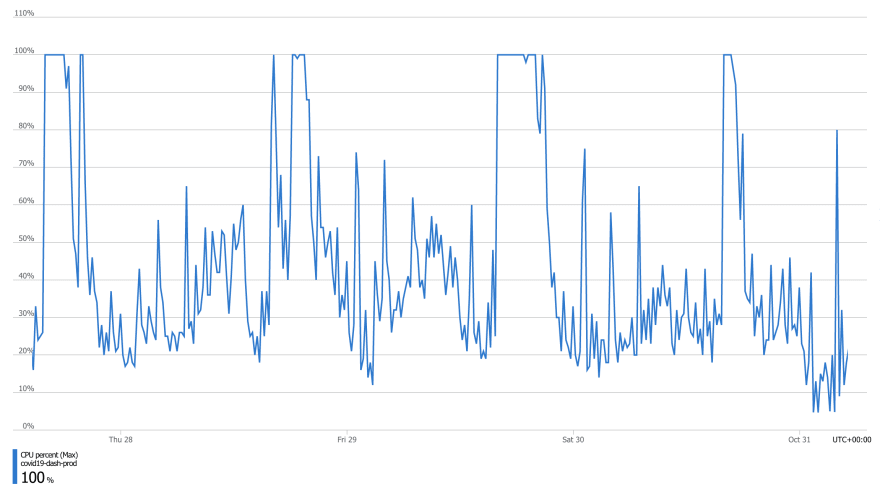
This could not be happening; not on this server. But it was!
I alerted the Azure Postgres team; but they are mostly based in the US, and it was all happening on a Sunday... not just any Sunday, it was the Halloween 🎃. Remember that this isn't Azure support, this is the core development team for the service, and folks that I know aren't on-call 24 / 7.
I had no time to do much at that point, it was 2:50pm already — all I knew was that I needed to reduce the load on the database to enable the deployment of data. All I could think of then point was to forcibly reduce the number of connections to the database to reduce the load, and so I turned off 70% of our servers. That did the trick, and we managed to deploy the first chunk of data at 3:08pm. We finished by the skin of our teeth at 3:58pm, I turned the servers back on, and we managed to release the data at 4:01pm.
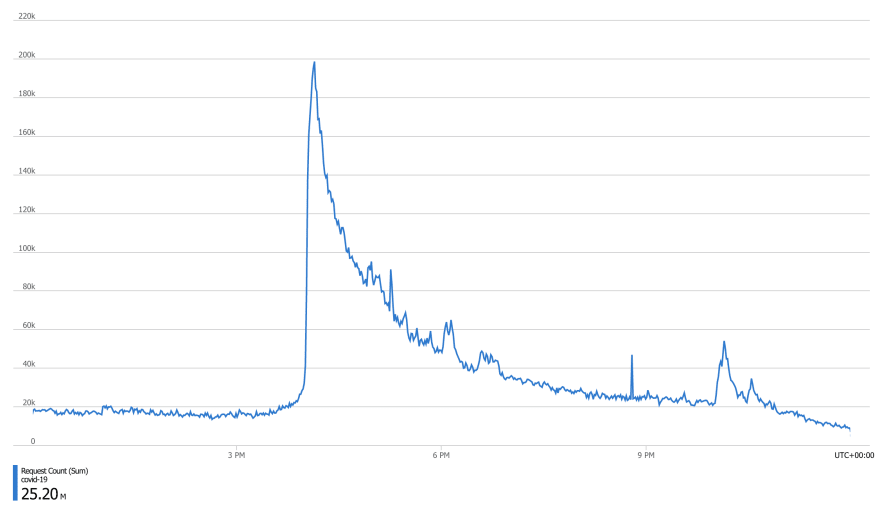
Next, we experience significant deterioration in APIv1. The issue had now become very critical. APIv1 is our Open Data API. It is the one we use to show the data on the website, and is heavily used by different organisations — from local authorities, to the Department of Health and No 10 Downing Street, to WHO, to Johns Hopkins University. Issues with this API became noticeable at 4:30pm on Sunday, 31 October 2021.
It is important to put this into perspective. Most of the reports I had received thus far were talking about issues at release time. That is when we release the daily data and sustain a massive lightening surge in demand. Here is how our traffic looks at release time:
This means that a few failures here and there are expected, but not at 50% rate, as was the case on Sunday, 31 October 2021:
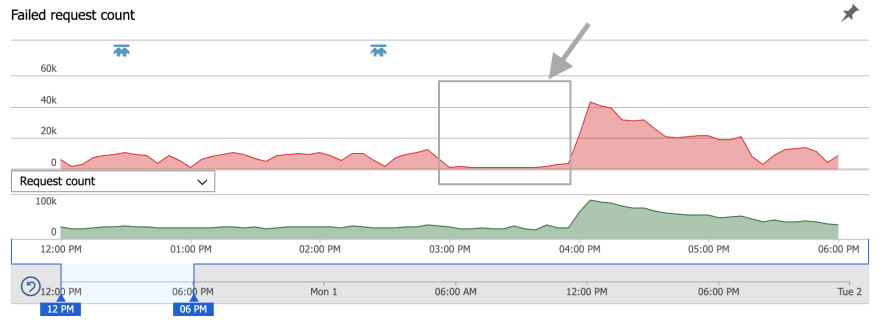
There was another interesting pattern there. See the part highlighted using a grey arrow. That's when 70% of the servers were turned off, yet the number of failed requests had decreased! But this can't be. We had a lot of free connections available, so we couldn't have been running out of connections. Granted, it wasn't during the peak, so we weren't using all the servers anyway, but still, reduced failure on 70% less capacity?
There was another interesting pattern there. See the part highlighted using a grey arrow. That's when 70% of the servers were turned off, yet the number of failed requests had decreased! But this can't be. We had a lot of free connections available, so we couldn't have been running out of connections. Granted, it wasn't during the peak, so we weren't using all the servers anyway, but still, reduced failure on 70% less capacity?
That's where things became even more complicated.
After extensive investigation and benchmarking, it turned out that our queries were taking significantly longer to run.
For instance, this is a well-optimised, tested query from our Generic API that should — under normal circumstance — run in ~1.5 milliseconds:
SELECT
   area_code    AS "areaCode",
   area_name    AS "areaName",
   ar.area_type AS "areaType"
FROM covid19.area_reference AS ar
WHERE LOWER(area_type) = LOWER('region')
  AND area_name ILIKE 'London'
LIMIT 1 OFFSET 0;
So I analysed the query as follows:
EXPLAIN (ANALYZE, BUFFERS)
SELECT
   area_code    AS "areaCode",
   area_name    AS "areaName",
   ar.area_type AS "areaType"
FROM covid19.area_reference AS ar
WHERE LOWER(area_type) = LOWER('region')
  AND area_name ILIKE 'London'
LIMIT 1 OFFSET 0;
And the response was as follows:
...
  Buffers: shared hit=5
Planning Time: 0.119 ms
Execution Time: 57.190 ms
It took ~57.2ms to run! But how is that possible? It's an increase of nearly 40x.
I then check the activities in the database to see how many queries are running, and for how long:
SELECT usename,
       state,
       query,
       state_change - query_start AS time_lapsed
FROM pg_stat_activity;
There were 140 queries, but more than half of them included this:
WITH RECURSIVE typeinfo_tree(
    oid, ns, name, kind, basetype, elemtype, elemdelim,
    range_subtype, attrtypoids, attrnames, depth)
AS (
    SELECT
        ti.oid, ti.ns, ti.name, ti.kind, ti.basetype,
        ti.elemtype, ti.elemdelim, ti.range_subtype,
        ti.attrtypoids, ti.attrnames, 0
    FROM
            (...
These queries showed as IDLE and the
time_lapsed between submission and state change were quite noticeable. After more investigation, it turned out that this query is sent by asyncpg, the driver API that we use in our Python codebase to perform async operations with Postgres.
Further research revealed that the issue had already been encountered by others in the community:
 Simple query runs long when DB schema contains thousands of tables
#186
Simple query runs long when DB schema contains thousands of tables
#186

sergeyspatar
posted on
- asyncpg version: 0.12
- PostgreSQL version: 9.6.4
- Python version: 3.5.3
- Platform: Linux x86_64 (Debian Stretch)
- Do you use pgbouncer?: no
- Did you install asyncpg with pip?: no
- If you built asyncpg locally, which version of Cython did you use?: 0.25.2
- Can the issue be reproduced under both asyncio and uvloop?: yes
My DB schema contains thousands of tables inherited from one table. These tables store some logs or historical information and have around 100 columns. As a result, PostgreSQL information schema table pg_attribute contains enormous number of records.
I use my own DB user sergey to connect to PostgreSQL who is a superuser. When I connect as this user, some simple queries run very long in asyncpg.
Preparation. This code creates 5000 inherited tables with 100 columns to prepare similar environment for the test cases below:
import asyncpg
import asyncio

loop = asyncio.get_event_loop()

async def run():
    conn = await asyncpg.connect(user='sergey')
    await conn.execute(
        'create table testlog ({})'.format(
            ','.join('c{:02} varchar'.format(n) for n in range(100))
        )
    )
    for n in range(5000):
        await conn.execute(
            'create table testlog_{:04} () inherits (testlog)'.format(n)
        )

loop.run_until_complete(run())
Example 1: Connect as sergey and run this simple query:
import asyncpg
import asyncio

#import uvloop
#asyncio.set_event_loop(uvloop.new_event_loop())

loop = asyncio.get_event_loop()

async def run():
    conn = await asyncpg.connect(user='sergey')
    return await conn.fetch('select $1::integer[]', [1, 2, 3])

print(loop.run_until_complete(run()))
While it was running for about 2 minutes, I saw this query in pg_activity_stat:
WITH RECURSIVE typeinfo_tree(
    oid, ns, name, kind, basetype, has_bin_io, elemtype, elemdelim,
    range_subtype, elem_has_bin_io, attrtypoids, attrnames, depth)
AS (
    WITH composite_attrs
    AS (
    SELECT
        c.reltype                    AS comptype_oid,
        array_agg(ia.atttypid ORDER BY ia.attnum)    AS typoids,
        array_agg(ia.attname::text ORDER BY ia.attnum)   AS names
    FROM
        pg_attribute ia
        INNER JOIN pg_class c
        ON (ia.attrelid = c.oid)
    WHERE
        ia.attnum > 0 AND NOT ia.attisdropped
    GROUP BY
        c.reltype
    ),

    typeinfo
    AS (
    SELECT
        t.oid               AS oid,
        ns.nspname              AS ns,
        t.typname               AS name,
        t.typtype               AS kind,
        (CASE WHEN t.typtype = 'd' THEN
        (WITH RECURSIVE typebases(oid, depth) AS (
Unfortunately, pg_activity_stat does not show the whole query but only first part. I guess the slow execution has to do with the size of pg_attribute.
Example 2: Now connect as user postgres and run the same query. It is still not instant but much faster (~1 second):
import asyncpg
import asyncio

#import uvloop
#asyncio.set_event_loop(uvloop.new_event_loop())

loop = asyncio.get_event_loop()

async def run():
    conn = await asyncpg.connect(user='postgres')
    return await conn.fetch('select $1::integer[]', [1, 2, 3])

print(loop.run_until_complete(run()))
Example 3: Not all queries execute long. This one is fast:
import asyncpg
import asyncio

#import uvloop
#asyncio.set_event_loop(uvloop.new_event_loop())

loop = asyncio.get_event_loop()

async def run():
    conn = await asyncpg.connect(user='sergey')
    return await conn.fetch('select $1::integer', 1)

print(loop.run_until_complete(run()))
P.S. I tried vacuum full analyze pg_attribute and vacuum full analyze pg_class, it did not help.
Based on discussions in the issue ticket, it appears that the problem is associated with a setting entitled Just-in-time Compilation (JIT) that is turned on by default in Postgres 14 when it is compiled using LLVM.
I found this at around 11:40pm on Monday, 1 November 2021, after some discussions I had earlier at around 9:30pm with the Azure Postgres (Citus) team, where JIT was mentioned as a possible culprit.
I was still not satisfied that this was the issue, but then the Citus team messaged me, saying that after some extensive investigation, they also think the issue originates in JIT having been turned on. What was more interesting was that they sent me the same discussion I had found on GitHub.
We now had a hypothesis, and needed to test it. So they sent me a fairly chunky query to run and evaluate the result:
Planning Time: 3.283 ms
JIT:
  Functions: 147
  Options: Inlining true, Optimization true, Expressions true, Deforming true
  Timing: Generation 17.460 ms, Inlining 15.796 ms, Optimization 525.188 ms, Emission 350.897 ms, Total 909.340 ms
Execution Time: 911.799 ms
Right then, we had a benchmark. But look again, we also have the issue revealing itself right there too:
JIT:
  Functions: 147
  Options: Inlining true, Optimization true, Expressions true, Deforming true
  Timing: Generation 17.460 ms, Inlining 15.796 ms, Optimization 525.188 ms, Emission 350.897ms, Total 909.340 ms
JIT optimisation process took
Total 909.340 ms to run! Time to turn JIT off — it's now 12:20am, so it's as good a time as any to experiment... and we did:

At 12:22am, we ran the above query again, and this is what we saw:
Planning Time: 3.159 ms
Execution Time: 0.409 ms
And just like that, the execution time reduced by 2,229 folds 😲.
Next day, we saw a substantial change in the CPU stats in Postgres. The vertical line in the following image shows 12:22am, the point at which JIT was turned off:

Problem solved! 🎉
Issues such as this are quite difficult to identify. This is because they manifest themselves as a cascade of problems whose trail needs to be followed. Even then, one needs to do some detective work and research to pinpoint the cause.
JIT compilation is a useful optimisation feature — no question. It is, however, not one to be turned on by default. It should only be used in such scenarios as follows:
Think of it as JIT compilers in Python or .NET, which optimise the code to make it run faster. They are extremely useful in long running applications. They make you wait less, and they reduce the cost of running the application.
The benefits in such cases are significant because the additional overhead is not noticed beyond the startup phase, which is when the JIT process does the compilation.
This is not, however, the case when we are making short, well-optimised queries from a database tens if not hundreds of times per second — certainly not when we are doing the compilation for the same query each time it is submitted. This wouldn't cause any issues if compiled queries were cached, but as things currently stands, they are not.
The cache for such queries may be stored in binary format with the hash of the query string set as the key. The time-to-live (TTL) of the cache could be set using an adjustable setting with a default duration set to something like 5 minutes. It is, however, important to appreciate that the core Postgres team encompasses some very smart and competent software engineers who know what they are doing and would have definitely thought of caching compiled queries. This leaves me to believe this approach has not been adopted for reasons of which we may not be aware.
Playing with JIT thresholds to base its activation on transaction cost won't, in my opinion, have a significant impact — not when you are dealing with a massive, but adequately indexed database.
Another issue here is back-pressure. When an otherwise optimised query that should take 1 millisecond takes 5 seconds to execute — possibly because it contains a recursive CTE — the database (CPU) remains occupied. JIT compilation is a CPU intensive process, and there are only so many such queries the database can concurrently execute.
This means that other queries, possibly even identical ones — of which there may be hundreds — are idled and queued for execution, creating a backlog of delayed jobs.
This sets off a chain of events, or as I call it: the cascade of doom. You end up with seemingly small processes saturating the CPU or awaiting JIT compilation:
... and the rest is history.
There is no absolute workflow to follow. It really depends on the application. A good way to determine its usefulness, however, is to turn JIT on for a specific transaction and do some benchmarking:
BEGIN;
SET LOCAL jit = ON;

EXPLAIN (BUFFERS, ANALYSE)
-- The query
;

COMMIT;
Note that if your query is too simple and falls below the threshold for
jit_above_cost, the process may not be activated. You can temporarily decrease the threshold to mitigate this.Let's evaluate a query from our database as an example.
Without JIT:
EXPLAIN (BUFFERS, ANALYSE)
SELECT metric,
       area_code,
       MAX(area_name) AS area_name,
       percentile_cont(.25) WITHIN GROUP (ORDER BY (ts.payload ->> 'value')::FLOAT) AS first_quantile,
       percentile_cont(.5)  WITHIN GROUP (ORDER BY (ts.payload ->> 'value')::FLOAT) AS median,
       percentile_cont(.75) WITHIN GROUP (ORDER BY (ts.payload ->> 'value')::FLOAT) AS third_quantile
FROM covid19.time_series AS ts
  JOIN covid19.area_reference   AS ar ON ar.id = ts.area_id
  JOIN covid19.metric_reference AS mr ON mr.id = ts.metric_id
WHERE ts.date BETWEEN '2021-08-05' AND '2021-11-05'
  AND ts.partition_id = '2021_11_10|ltla'
  AND NOT (metric ILIKE '%direction%' OR metric ILIKE '%demog%')
GROUP BY metric, area_code
ORDER BY median DESC;
QUERY PLAN
Planning:
Buffers: shared hit=29
Planning Time: 2.163 ms
Execution Time: 13024.737 msNow with JIT:
BEGIN;

SET LOCAL jit = ON;
SET LOCAL jit_above_cost = 10;

EXPLAIN (BUFFERS, ANALYSE)
SELECT metric,
       area_code,
       MAX(area_name) AS area_name,
       percentile_cont(.25) WITHIN GROUP (ORDER BY (ts.payload ->> 'value')::FLOAT) AS first_quantile,
       percentile_cont(.5)  WITHIN GROUP (ORDER BY (ts.payload ->> 'value')::FLOAT) AS median,
       percentile_cont(.75) WITHIN GROUP (ORDER BY (ts.payload ->> 'value')::FLOAT) AS third_quantile
FROM covid19.time_series AS ts
  JOIN covid19.area_reference   AS ar ON ar.id = ts.area_id
  JOIN covid19.metric_reference AS mr ON mr.id = ts.metric_id
WHERE ts.date BETWEEN '2021-08-05' AND '2021-11-05'
  AND ts.partition_id = '2021_11_10|ltla'
  AND NOT (metric ILIKE '%direction%' OR metric ILIKE '%demog%')
GROUP BY metric, area_code
ORDER BY median DESC;

COMMIT;
QUERY PLAN
Planning:
Buffers: shared hit=29
Planning Time: 2.090 ms
JIT:
Functions: 8
Options: Inlining false, Optimization false, Expressions true, Deforming true
Timing: Generation 1.471 ms, Inlining 0.000 ms, Optimization 0.485 ms, Emission 6.421 ms, Total 8.377 ms
Execution Time: 12750.490 msWe can see that despite the overhead, the execution time is — albeit marginally — shorter with JIT.
We all enjoy one-size-fits-all solutions, but unfortunately there is no such thing in high performance computing.
It is often easy to look from the outside and prescribe a generic solution to any given problem; however, whether or not such solutions prove helpful may only be determined through meticulous experimentation on the specific product.
Following this incident, the Postgres team at Microsoft Azure have decided to consider changing the default setting in Postgres 14 and turn JIT off for new instances.
Finally, I would like to thank the Azure Postgres (Hyperscale) team for their commitment and dedicate support, day, night, and midnight!
32