17
How to Use React Developer Tools
One tool that comes in handy when developing React applications is React Dev Tools. It allows you to inspect React component hierarchies in the browser developer tools. And in this guide, we're gonna learn how to use it!
To start using React developer tools. We need to install it as a browser extension. Click one of the links below to install it. Currently, the extension is supported by these browsers:
Once you have developer tools installed. It's time to start using them.
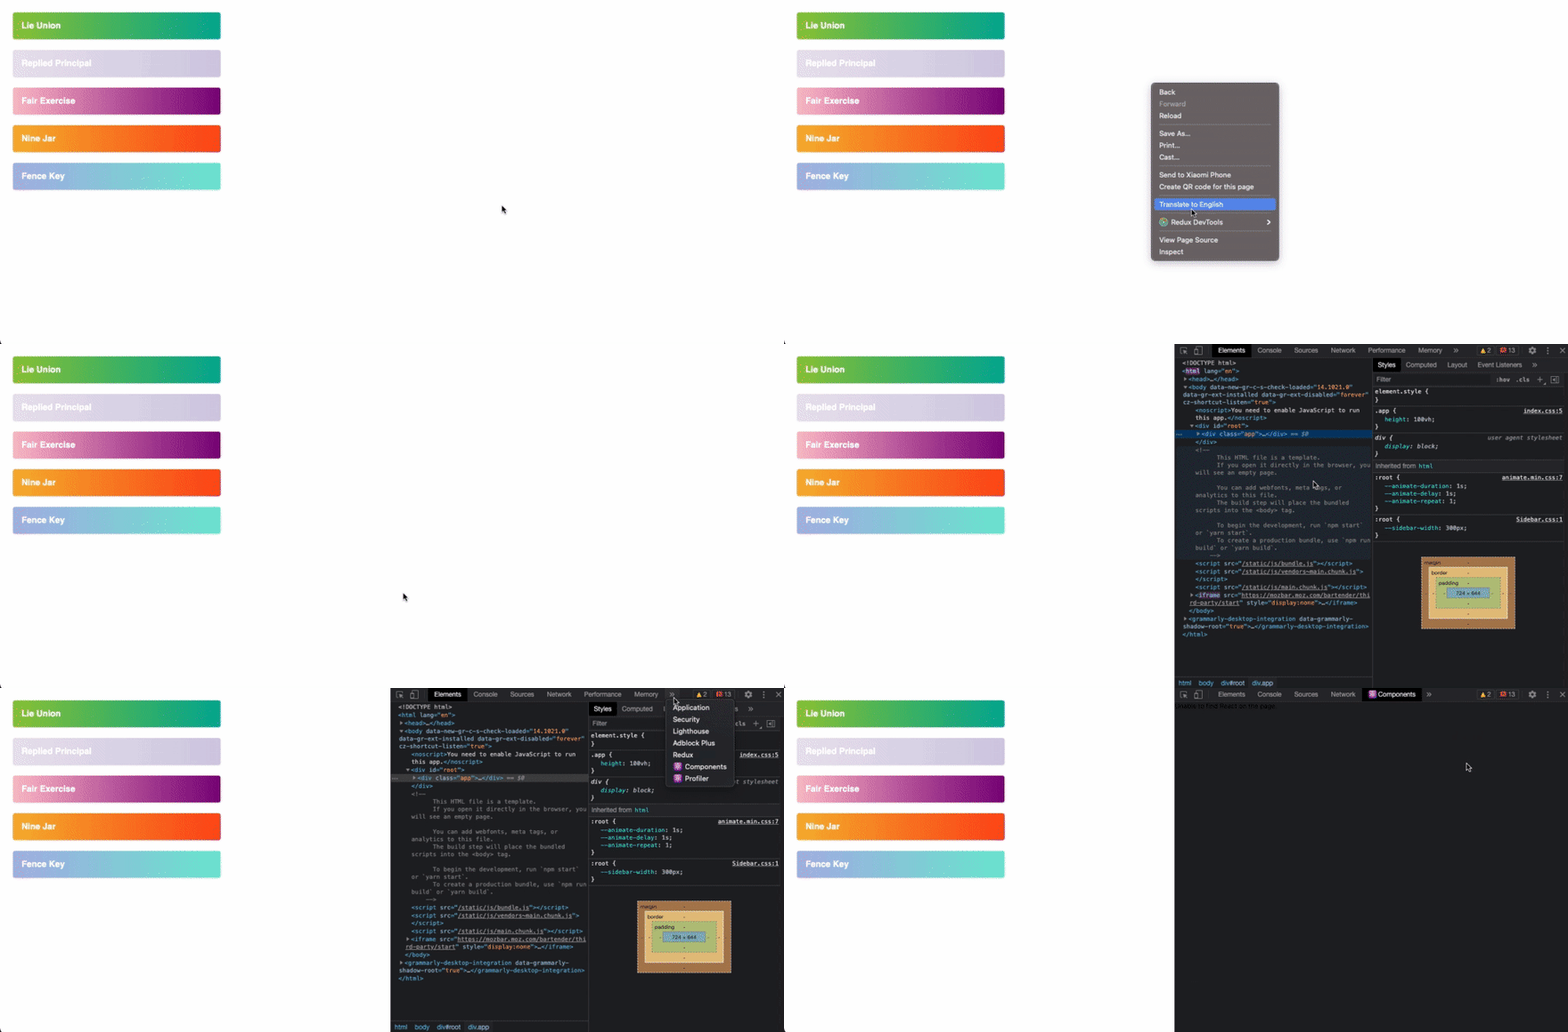
To open the extension. Right-click anywhere in the browser window and click on Inspect. Additionally, you can open it by pressing F12. This will open browser developer tools with all the usual tabs like Elements, Console, etc.

Because we installed React dev tools extension. We get access to 2 new tabs:
The main purpose of
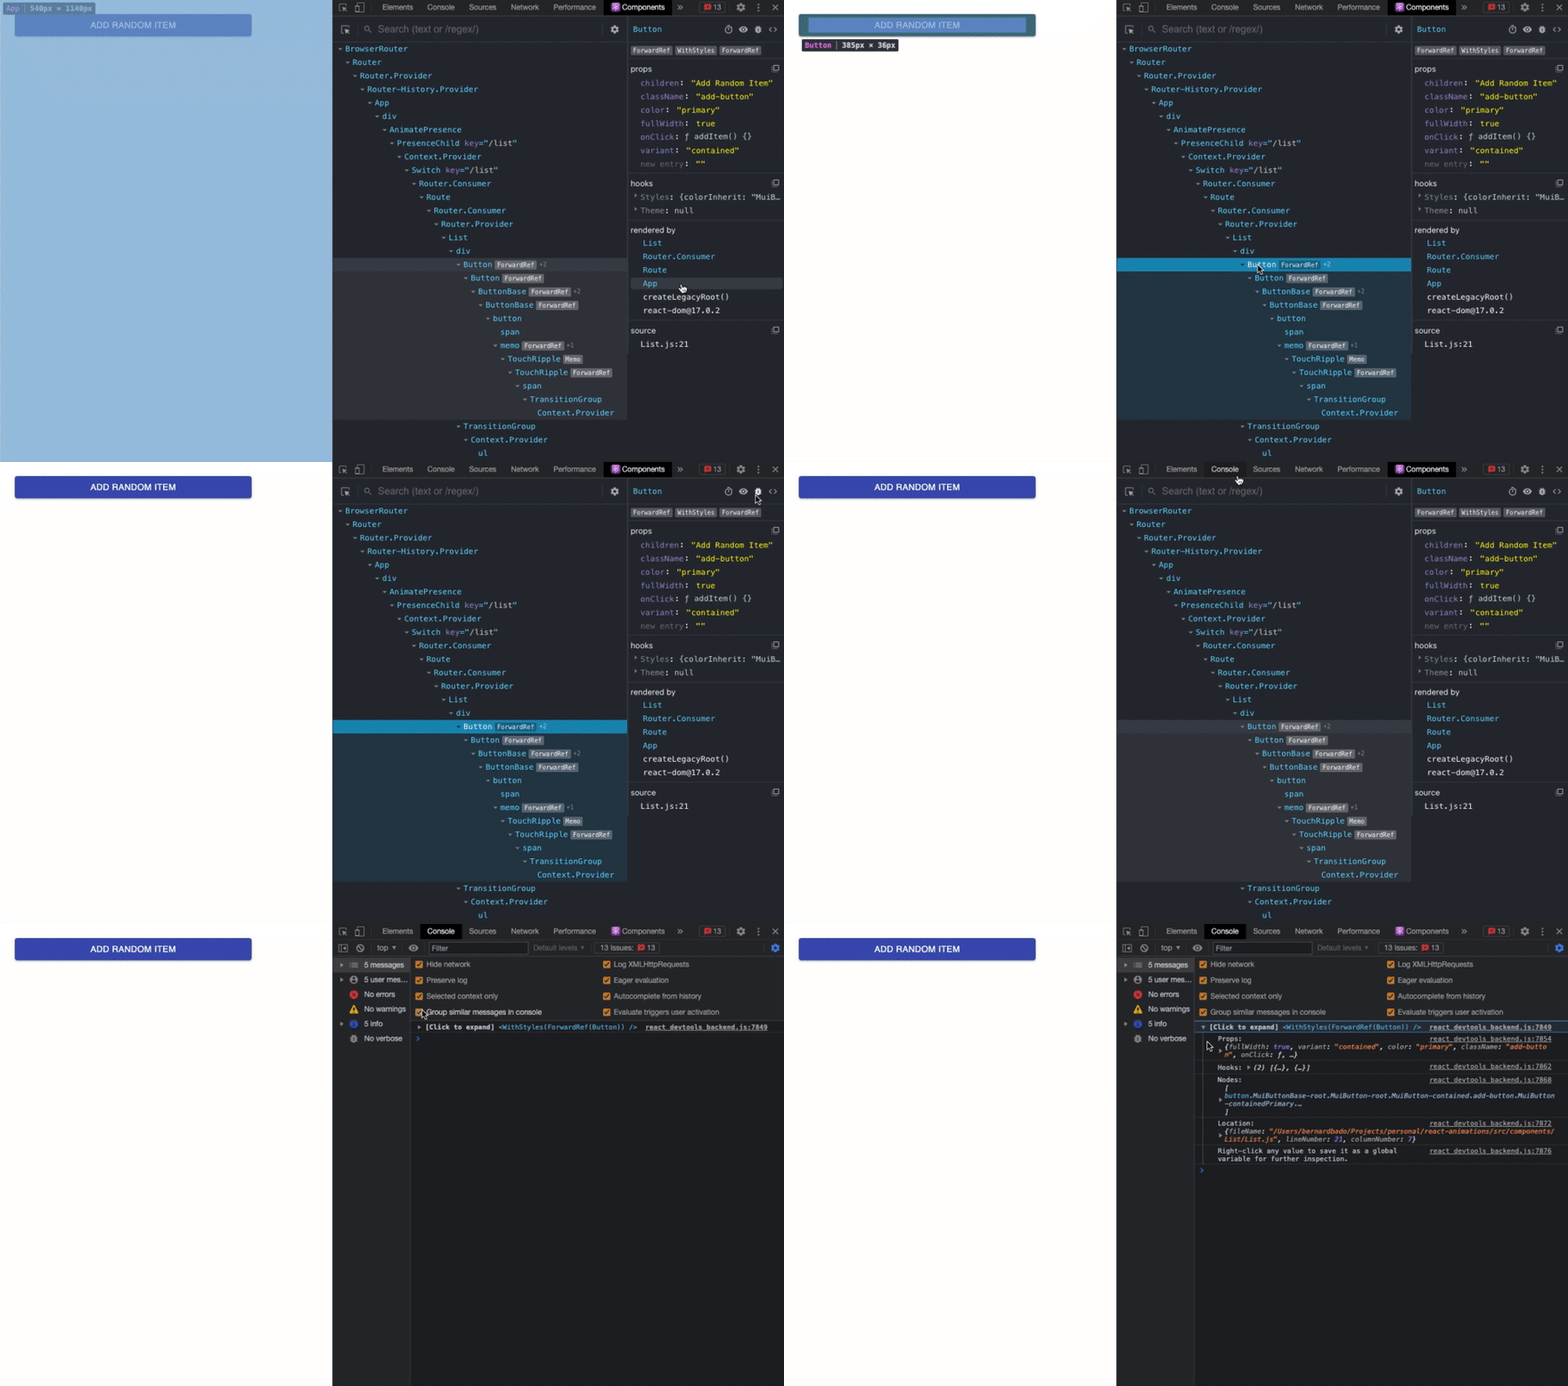
Components tab is to show us the structure of the React application. The structure shows how are all the components nested. In addition, we also get other useful information about the components. E.g. props, state, context, functions, etc... We'll talk more about them later. But for now - let's see how can we find the component we need inside the component tree.The are multiple ways to locate the component inside React dev tools. The most simple one is to use the arrow in the top-left corner. Then simply point and click on the component we want to inspect.

If we know the name of the component we want to locate. We can use a built-in search bar that will find and highlight components for us. This is especially useful if we have a component tree that is deeply nested.

The one useful thing to remember is this.
Components and Elements tab interact with each other. If we select any component in Components . It will also get selected in Elements. It also works another way around. In the example below, selecting button will automatically select Button in Components tab.
Most of the time, we want to see what's happening inside our components. Using React developer tools, we can see a lot of useful information about the component. We can also see, how is the information changing as we interact with the application.
In the example below, we can see state changing as we're adding or removing new items. This also works another way around. This means we can manipulate state within developer tools, without any interaction with the UI. In the example below, we're removing items. By modifying the component state directly in the dev tools.

Components tab is also connected to Console. Once we have a component selected, we can switch over to
Console and type $r. It will give us all the information we see in the Components tab.This way, we can interact with the component using our beloved console. In addition, we can also call functions that the component has access to. I believe every front-end developer will find this handy.

Now that we know how to inspect our components. We can quickly find out if there are any issues within them. And if there are, it's time to find out why.
React developer tools make it easy to inspect source code directly in the browser window. Preventing us from constantly switching between code editor and browser. All we need to do is select the component. And click on the
<>. This will open up the corresponding file, where we can see what's wrong with the code.
We get this feature by default if we're using create-react-app or Next.js. But if you can't see the original code of your component, you'll need to add babel-plugin-transform-react-jsx-source to your Webpack configuration.
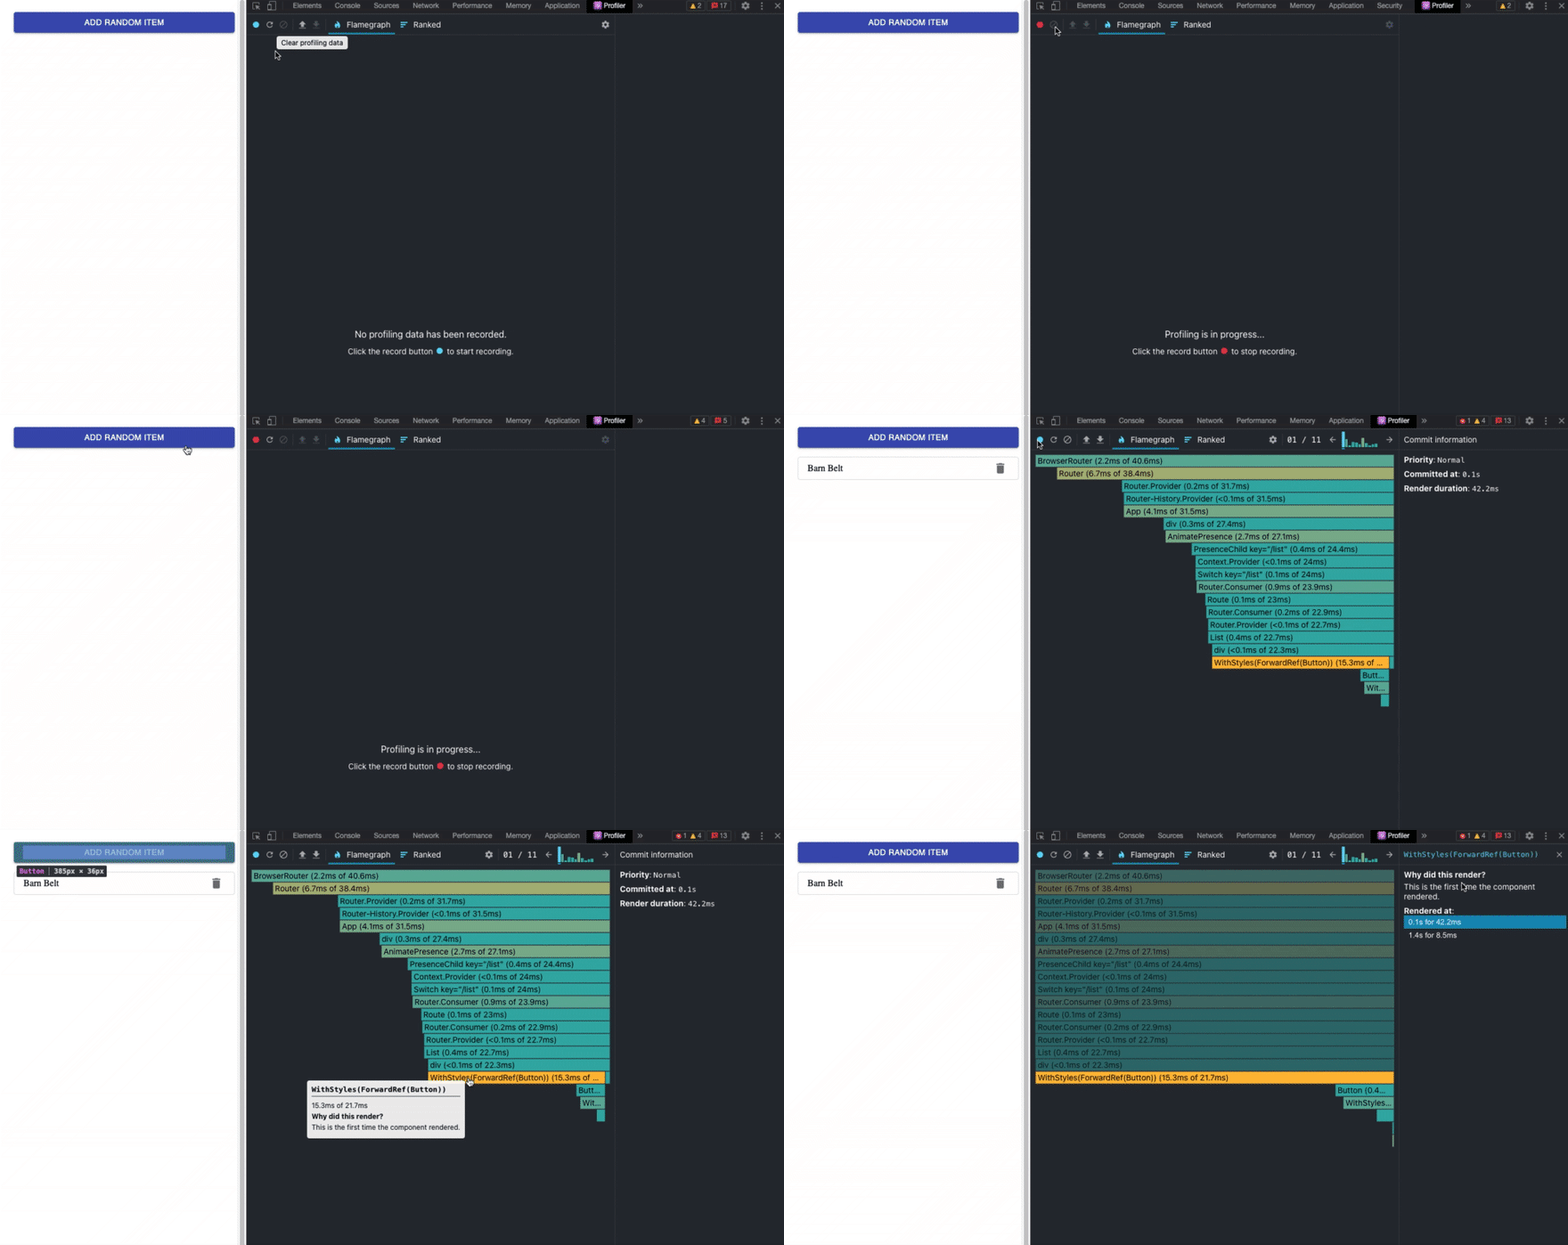
Using these tools, we can easily observe how our application behaves. And fix the issues as they're coming up. When the application is stable and bug-free. It's time to optimize its performance. And for that, we can use
Profiler.Profiler shows us how long it takes to render each component of our app. We can identify what component is slowing down our application. And of course, improve its performance!In this example, we can see that rendering material-ui Button is taking most of our rendering time. Not that it's slow. But if we want to make our app even faster. We can replace it with custom
Button component.
It also shows if the component was rerendered and what triggered the rendering. It's worth checking out if there aren't any unnecessary re-renders happening in our app. And if they are, we most likely can optimize them. Making our React website much faster.
React developer tools come with a lot of handy features that can make our developer experience better. In this article, we showed how to install them. Showcased in what situations and how can we use them.
We also provided useful tips and tricks. Which can make using React developer tools much easier.
New features are constantly added to React DevTools. React DevTools v4 was released in August 2019. Improving performance, Simplified navigation, and support for React Hooks. Since then, React team is continuously working on making this tool better and better!
New features are constantly added to React DevTools. React DevTools v4 was released in August 2019. Improving performance, Simplified navigation, and support for React Hooks. Since then, React team is continuously working on making this tool better and better!
17
