30
Xdebug the Machine!
Just the Gist
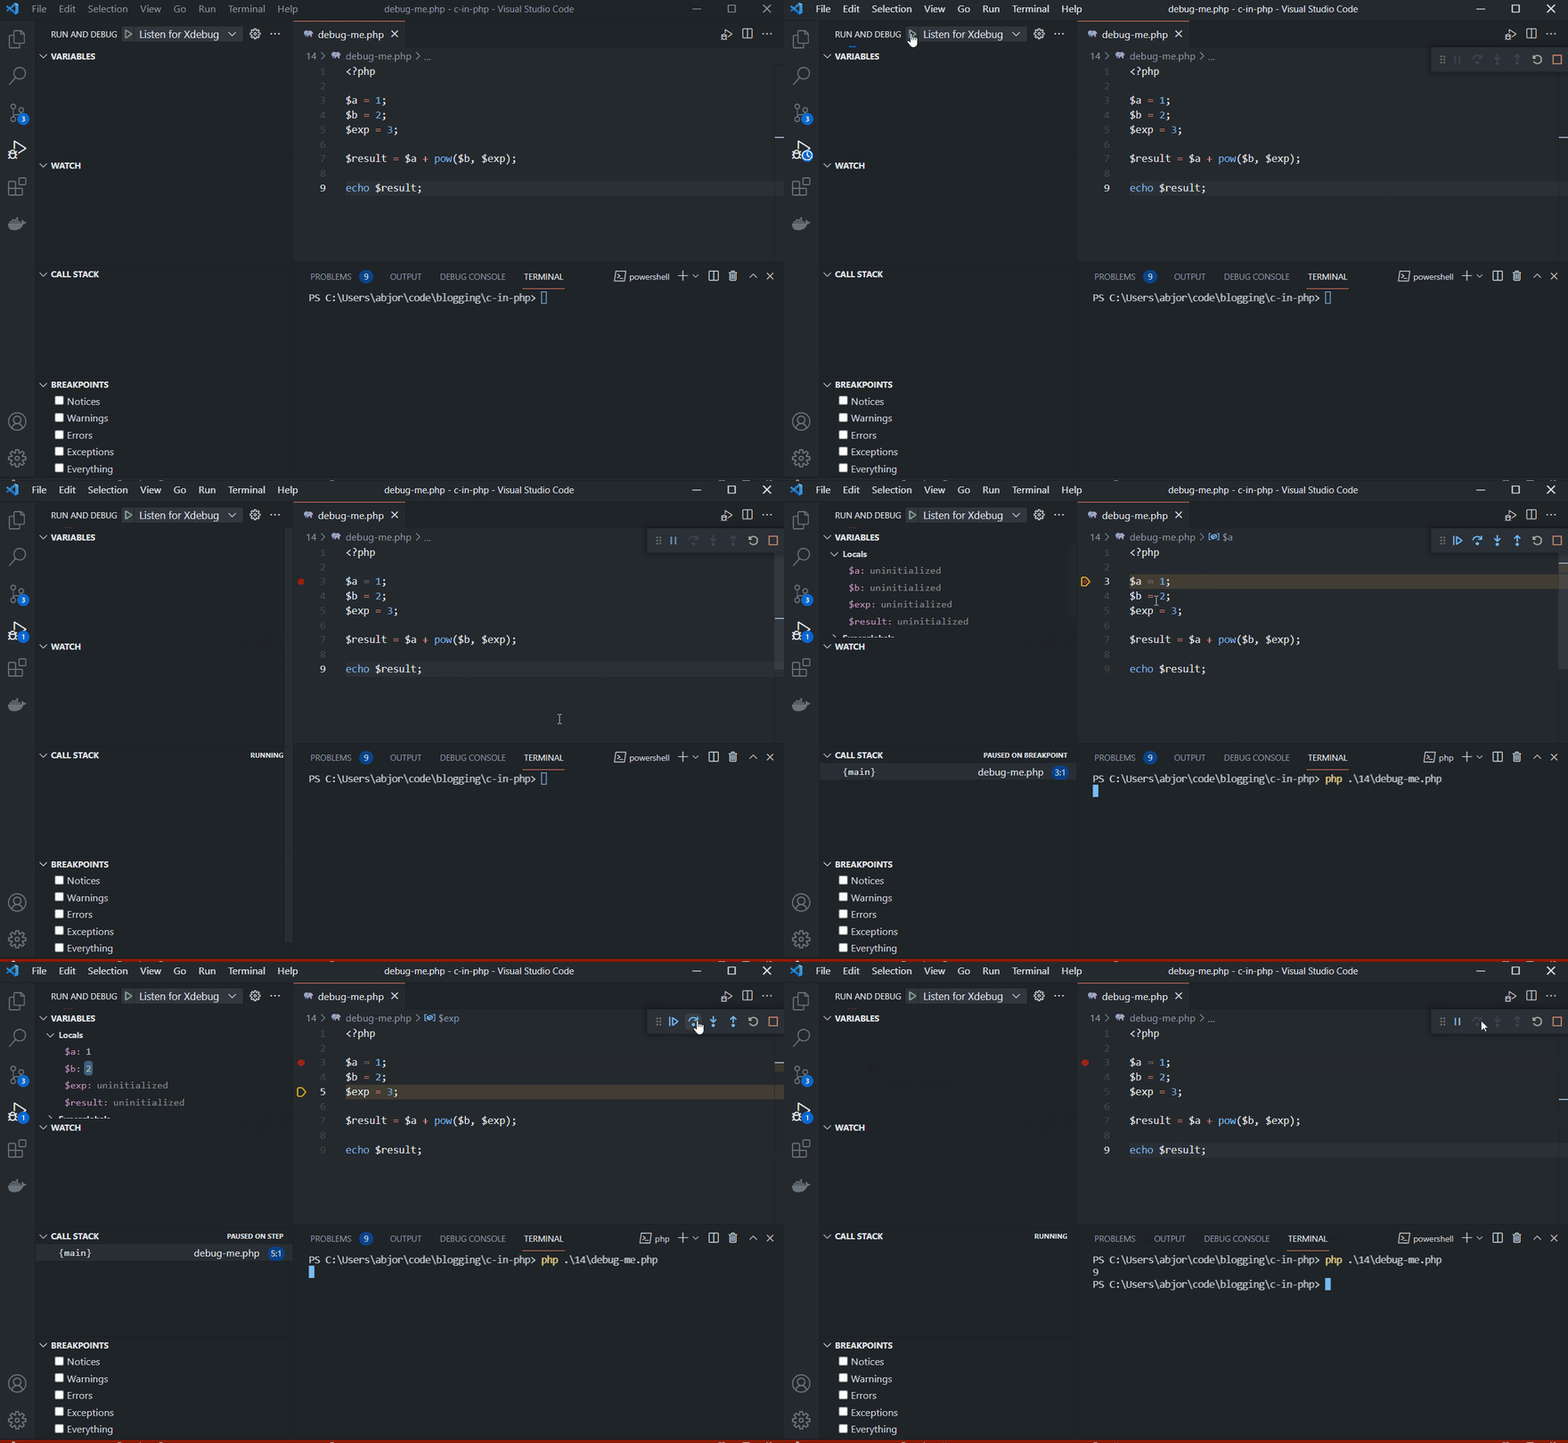
On December 13th we peeked at variables with the help of a different built-in functions. But there are more powerful ways you can debug your code. Xdebug is a debugging extension for PHP. It will let you glimpse all the variables and their values at the breakpoint of your choosing. You can then step through the execution of your code, line by line if you want. Today we will see how to install and use Xdebug in VSCode.
Correction: Previous version stated that Xdebug would listen for requests when PHP is executed. Instead it's that an IDE, or in this case the plugin in VSCode, that listens and then Xdebug makes a connection to it.
The official installation instructions are here: https://xdebug.org/docs/install. There are many ways to install the extension, and there are instructions for most OS's. You can download it either from the official website or from the PHP extensions repository, there is even a handy wizard to guide you for your specific environment. When you download the extension, you need to know what PHP-version you are using. Go into your terminal and type:
php -v. If you are on the latest PHP thread safe version it could look like this (if you use a non-thread safe version you would see NTS instead of ZTS):PHP 8.1.0 (cli) (built: Nov 23 2021 21:48:28) (ZTS Visual C++ 2019 x64)
Copyright (c) The PHP Group
Zend Engine v4.1.0, Copyright (c) Zend Technologies
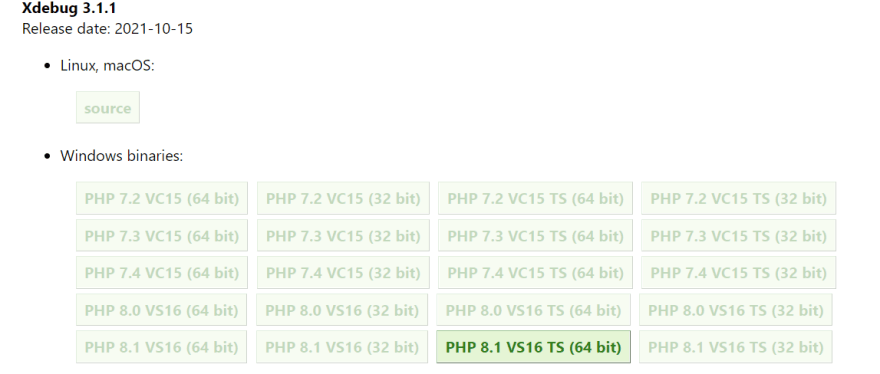
with Zend OPcache v8.1.0, Copyright (c), by Zend TechnologiesKnowing the version and if it is thread safe or not, you can choose the right version of the extension to download. Being on Windows and a 64-bit machine, I choose the appropriate version from the options below:

Half the work of getting the extension ready for use is done. The rest is to configure it. That's where we edit the
php.ini file. Find zend_extension=opcache (if you have it) and below it add zend_extension=xdebug. Next we are going to prepare xdebug to listen for breakpoints. So, while we are still in the
php.ini file, we are going to add the following lines:xdebug.mode = debug
xdebug.start_with_request = yesThese instructions starts xdebug whenever PHP is executed. It will then be able to connect to any IDE that listens for it. (So remember to change that
yes to no if you don't want to run xdebug whenever you execute PHP code.)Running
php -v again, you should now see xdebug listed below your PHP version.Now that we have the extension installed, we can get us the VSCode extension
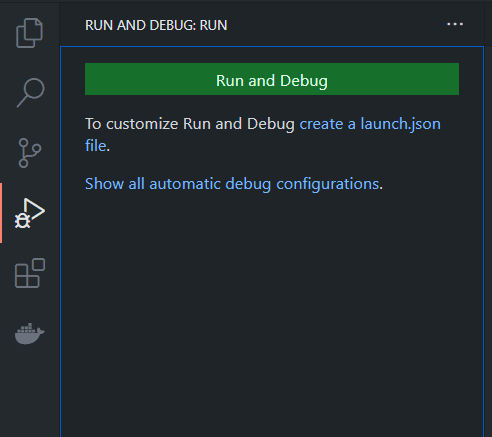
PHP Debug by Felix Becker. Search for php-debug in the VSCode marketplace and install it. Then click on the play-button with a bug on it.

You can be using this to debug your code, where ever you want. Perhaps it's a tool for you to inspect that api call that seems weird? Xdebug is a powerful tool to have, and it's a sure step up from
var_dump.Have you used any debugging tool like Xdebug, or maybe it was Xdebug that you tried? Do you prefer other ways of debugging your code? Do you think tests are a better tool than debugging your code? Or do you think they complement each other? Comment below and let us know what you think ✍
30
