34
Scaling Token Buckets Rate limiting with YugabyteDB
In the Part 4 of this series, I've run my
RateLimitDemo.java program on PostgreSQL in Amazon RDS with and without updating the same rows, in Read Committed and Serializable isolation. The results were:ids in Read Committed isolation levelids in Serializable isolation levelids in Read Committed isolation levelids in Serializable isolation levelIn the same idea of using a managed service I've created a 3 nodes YugabyteDB cluster on AWS through the Yugabyte DBaaS:

In my
RateLimitDemo.java I change the id to concatenate the session pid: rate_limiting_token_bucket_request(?||pg_backend_pid(),?) and I set Read Committed isolation level: connection.setTransactionIsolation(Connection.TRANSACTION_READ_COMMITTED)java RateLimitDemo 50 "jdbc:yugabytedb://47cc8863-9344-4a9c-bc02-0dd9f843dceb.cloudportal.yugabyte.com/yugabyte?user=admin&password=Covid-19" "user2" 1000 20 | awk 'BEGIN{t=systime()}/remaining$/{c=c+1;p=100*$5/$3}NR%100==0{printf "rate: %8.2f/s (last pct: %5.2f) max retry:%3d\n",c/(systime()-t),p,retry}/retry/{sub(/#/,"",$6);if($6>retry)retry=$6}'The Read Committed is provided for PostgreSQL compatibility but is not recommended, so I'm just showing that the rate is the same as with PostgreSQL:
rate:  1063.08/s (last pct: 100.00) max retry:  1
rate:  1063.32/s (last pct: 100.00) max retry:  1
rate:  1063.56/s (last pct: 100.00) max retry:  1
rate:  1063.80/s (last pct: 100.00) max retry:  1
rate:  1064.05/s (last pct: 100.00) max retry:  1
rate:  1064.29/s (last pct: 100.00) max retry:  1
rate:  1064.53/s (last pct: 100.00) max retry:  1
rate:  1062.20/s (last pct: 100.00) max retry:  1
rate:  1062.44/s (last pct: 100.00) max retry:  1
rate:  1062.68/s (last pct: 100.00) max retry:  1
rate:  1062.92/s (last pct: 100.00) max retry:  1
rate:  1063.16/s (last pct: 100.00) max retry:  1
There's one difference with PostgreSQL which, using pessimistic locking had no retries. YugabyteDB uses optimistic locking here.
In my
RateLimitDemo.java I keep the id to concatenated the session pid: rate_limiting_token_bucket_request(?||pg_backend_pid(),?) and I set Read Committed isolation level: connection.setTransactionIsolation(Connection.TRANSACTION_SERIALIZABLE)The throughput is the same:
rate:  1079.99/s (last pct: 100.00) max retry:  2
rate:  1079.38/s (last pct: 100.00) max retry:  2
rate:  1079.44/s (last pct: 100.00) max retry:  2
rate:  1079.51/s (last pct: 100.00) max retry:  2
rate:  1079.57/s (last pct: 100.00) max retry:  2
rate:  1079.63/s (last pct: 100.00) max retry:  2
rate:  1079.69/s (last pct: 100.00) max retry:  2
rate:  1079.75/s (last pct: 100.00) max retry:  2
rate:  1079.81/s (last pct: 100.00) max retry:  2
rate:  1079.87/s (last pct: 100.00) max retry:  2
rate:  1079.94/s (last pct: 100.00) max retry:  2
rate:  1080.00/s (last pct: 100.00) max retry:  2
Serializable is the right isolation level. The amount of retries is still low.
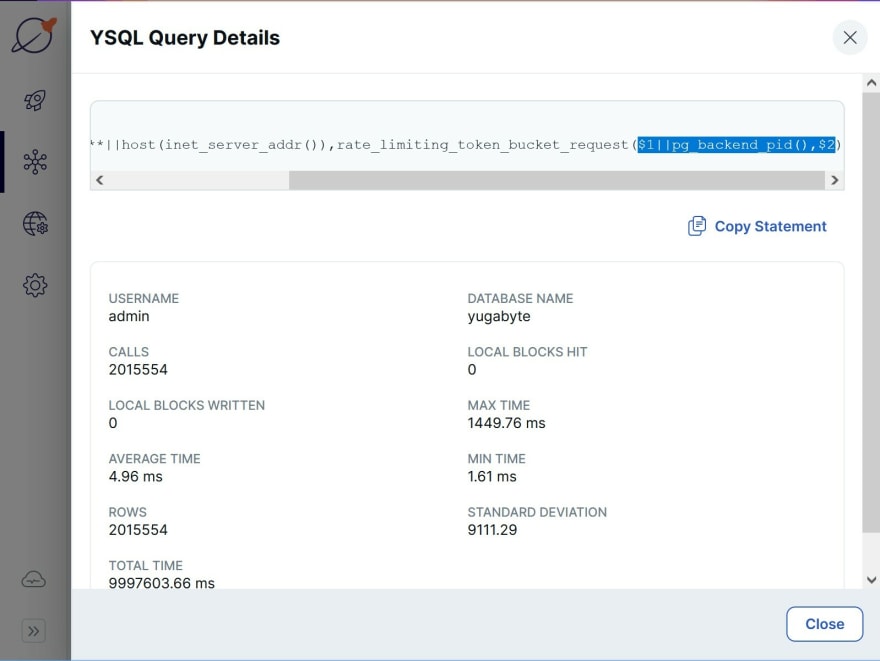
id has an additional insert)id those operations are sent to the right node, the tablet leader, and wait to get the write quorum from another node (I have a multi-AZ configuration here)We have a view on pg_stat_statements confirming this average time of 5 milliseconds.

"local block" stats are zero because there's no temporary table involved here. We do not display shared block hits because YSQL is stateless. The PostgreSQL code is reused only above the table access method, which transforms tuple manipulation to DocDB operations.

"local block" stats are zero because there's no temporary table involved here. We do not display shared block hits because YSQL is stateless. The PostgreSQL code is reused only above the table access method, which transforms tuple manipulation to DocDB operations.
So, this is about running this Token Bucket algorithm without collisions. The performance is the same as with PostgreSQL, with the additional possibility to scale out. The load is distributed to 3 nodes here, and replication factor RF=3 let all continue transparently if one node goes down for planned maintenance of unplanned outage.
Now stressing the race condition with 50 threads on the same
id. In my RateLimitDemo.java I put back the id alone: rate_limiting_token_bucket_request(?,?) and I set Read Committed isolation level: connection.setTransactionIsolation(Connection.TRANSACTION_READ_COMMITTED)rate: 126.99/s (last pct: 96.69) max retry: 4
rate: 127.59/s (last pct: 84.78) max retry: 4
rate: 127.39/s (last pct: 95.62) max retry: 4
rate: 127.17/s (last pct: 98.37) max retry: 4
rate: 126.97/s (last pct: 96.71) max retry: 4
rate: 127.58/s (last pct: 95.68) max retry: 4
rate: 127.38/s (last pct: 97.62) max retry: 4
rate: 127.15/s (last pct: 96.68) max retry: 4
rate: 127.76/s (last pct: 88.00) max retry: 4
rate: 127.54/s (last pct: 92.53) max retry: 4
rate: 127.34/s (last pct: 94.48) max retry: 4
rate: 127.91/s (last pct: 92.85) max retry: 4
rate: 127.69/s (last pct: 92.68) max retry: 4
rate: 127.50/s (last pct: 92.87) max retry: 4
rate: 128.02/s (last pct: 83.57) max retry: 4
rate: 127.78/s (last pct: 95.61) max retry: 4
rate: 128.33/s (last pct: 95.61) max retry: 4
rate: 128.14/s (last pct: 95.66) max retry: 4
rate: 128.74/s (last pct: 98.04) max retry: 4
rate: 128.51/s (last pct: 92.40) max retry: 4
rate: 128.29/s (last pct: 94.63) max retry: 4The rate is much lower here, like it was with PostgreSQL, because all threads compete to update the same row. First, only one node is busy, as this row is in one tablet. Second, there are retries, even in Read Committed isolation level.
Here is a the error cought:
(pid@host 23119@10.8.11.222)   3771 calls   3487 tokens      3.8 /sec 60000 remaining
(pid@host 22797@10.8.11.222)   2706 calls   2460 tokens      2.6 /sec 60000 remaining
(pid@host 23431@10.8.13.238)   1513 calls   1422 tokens      1.5 /sec 60000 remaining
2022-01-05T23:00:26.369987Z SQLSTATE 40001 on retry #0 com.yugabyte.util.PSQLException: ERROR: All transparent retries exhausted. Operation failed. Try again.: Value write after transaction start: { physical: 1641423626346947 } >= { physical: 1641423625848215 }: kConflict
2022-01-05T23:00:26.371342Z SQLSTATE 40001 on retry #0 com.yugabyte.util.PSQLException: ERROR: Operation expired: Transaction aborted: kAborted
(pid@host 22820@10.8.8.14)   2568 calls   2482 tokens      2.7 /sec 60000 remaining
(pid@host 23082@10.8.8.14)   2272 calls   2186 tokens      2.4 /sec 60000 remaining
This is the one I catch in my program, to retry it after a few milliseconds, but it was already retried automatically in the database (
All transparent retries exhausted). This explains why it is slower even with a small number of application retries.Last test, in my
RateLimitDemo.java I put back the id alone: rate_limiting_token_bucket_request(?,?) and I set Read Committed isolation level: connection.setTransactionIsolation(Connection.SERIALIZABLE)Given the previous result, I've reduced the number of threads to 10, as I did with PostgreSQL, and run it during the night. Here is the rate of tokens acquired per seconds:
rate:   116.60/s (last pct: 93.95) max retry:  8
rate:   116.60/s (last pct: 93.25) max retry:  8
rate:   116.60/s (last pct: 92.66) max retry:  8
rate:   116.60/s (last pct: 88.60) max retry:  8
rate:   116.60/s (last pct: 88.48) max retry:  8
rate:   116.60/s (last pct: 93.95) max retry:  8
rate:   116.59/s (last pct: 88.60) max retry:  8
rate:   116.59/s (last pct: 93.92) max retry:  8
rate:   116.59/s (last pct: 93.92) max retry:  8
rate:   116.59/s (last pct: 92.66) max retry:  8
rate:   116.59/s (last pct: 87.81) max retry:  8
rate:   116.59/s (last pct: 88.73) max retry:  8
rate:   116.59/s (last pct: 87.81) max retry:  8
rate:   116.58/s (last pct: 91.75) max retry:  8
rate:   116.58/s (last pct: 92.66) max retry:  8
rate:   116.58/s (last pct: 93.25) max retry:  8
rate:   116.58/s (last pct: 93.95) max retry:  8
rate:   116.58/s (last pct: 87.81) max retry:  8
rate:   116.58/s (last pct: 91.75) max retry:  8
rate:   116.59/s (last pct: 93.95) max retry:  8
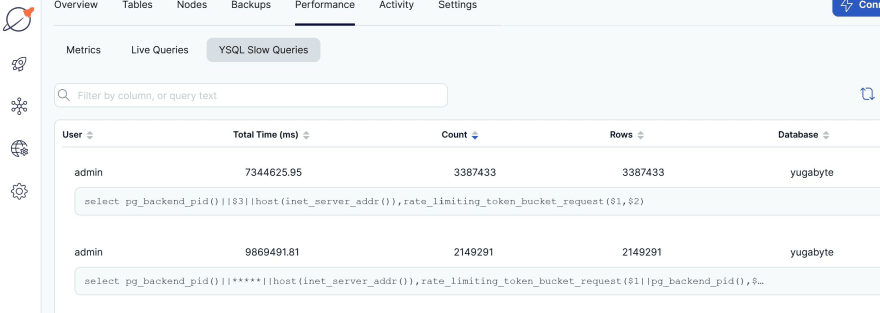
The throughput is low, given the update conflicts with all threads on the same row, but the latency stays good: 7344625.95/3387433=2.2 milliseconds on average for this query (the

The other one 9869491.81/2149291=4.6ms was the previous test on different
rate_limiting_token_bucket_request(?,?) one):
The other one 9869491.81/2149291=4.6ms was the previous test on different
id. Yes, in this race condition, throughput is lower as it cannot be distributed but response time is higher given data locality in RAM and CPU).The performance metrics show the same:

The night run is in the middle (I started another test with 10 threads on same

The night run is in the middle (I started another test with 10 threads on same
id and 50 threads on different ones, which is more realistic), with low CPU usage. If you are in this race condition with all token requests on few users or tenants IDs, and need higher throughput, this Token Bucket is not scalable. I'll show another algorithm in the next posts.34

