32
Optimistic or Pessimistic locking for Token Buckets Rate limiting in PostgreSQL
In a Part 2 of this series I defined a function to get tokens for API call rate limiting. I've run it in
\watch 0.01 loops in 8 sessions to show concurrent access for the same user. With PostgreSQL, the guarantee that reads and writes happen on the same state is enforced by pessimistic locking: sessions wait but don't fail. With YugabyteDB, optimistic locking is more scalable, but can fail on conflict. This must be handled by the application. In the Part 3 of this series, I introduced the JDBC driver for YugabyteDB. I'll use it even when connecting to PostgreSQL because all is compatible. But of course, no cluster-aware features will not be used as PostgreSQL has only one writer endpoint.Here is how I installed the driver (but check for newer releases):
wget -qc -O jdbc-yugabytedb.jar https://github.com/yugabyte/pgjdbc/releases/download/v1.0.0/jdbc-yugabytedb-42.3.0.jar
export CLASSPATH=.:./jdbc-yugabytedb.jar
The creation of the table and function is in the Part 2 of this series and I do not reproduce it here. All will go to a github repository at the end of this blog series.
I'll create a RateLimitDemo class with a
main() that defines the DataSource ("jdbc:yugabytedb://...) in args[1] and start a specific number of threads (args[0]). The call to the PL/pgSQL function defined in Part 2 takes a rate limit (args[3]) for an id (args[2]) which can be a user, a tenant, an edge location... on which we want to allow a maximum number of tokens per second. Each thread will connect to the data source (ds) and set the user requesting the tokens (id) with a rate of refill per second (rate token/s here) and the number of retries in case of transaction conflicts (max_retry passed in args[4]).The constructor
public RateLimitDemo(YBClusterAwareDataSource ds, String id, int rate, int max_retry connects and sets the default transaction isolation level to SERIALIZABLE and prepares the statement to call the procedure. The SELECT statement returns the host@pid session identification (rs.getString(1)) and the number of tokens (rs.getInt(2)). The query is:select
pg_backend_pid()||'@'||host(inet_server_addr()),
rate_limiting_token_bucket_request(?,?)I'll also run some variations adding the
pg_backend_pid() to the id to test without contention.The
public void run() is a loop that calls the token request stored function. If tokens are available ((rs.getInt(2) >= 0)) it increments the call counter. If not, it waits one second (Thread.sleep(1000))import java.time.*;
import java.sql.*;
import com.yugabyte.ysql.YBClusterAwareDataSource;
public class RateLimitDemo extends Thread {
private String id; // id on which to get a token
private int rate; // rate for allowed token / second
private int max_retry; // number of retry on tx conflict
private Connection connection; // SQL connection to the database
private PreparedStatement sql; // SQL statement to call to function
public RateLimitDemo(YBClusterAwareDataSource ds, String id, int rate, int max_retry) throws SQLException {
this.max_retry=max_retry;
this.connection=ds.getConnection();
this.sql = connection.prepareStatement(
"select pg_backend_pid()||'@'||host(inet_server_addr()),rate_limiting_token_bucket_request(?,?)"
);
this.sql.setString(1,id); // parameter 1 of sql function is the id requesting a token
this.sql.setInt(2,rate); // parameter 2 of sql function is the rate limit
this.connection.setAutoCommit(true);
this.connection.setTransactionIsolation(Connection.TRANSACTION_SERIALIZABLE);
}
public void run() {
try{
Instant t0=Instant.now(); // initial time to calculate the per-thread throughput
double total_duration; // duration since initial time
int total_tokens=0; // counter for accepted tokens
int retries=0; // retries before failure
for(int i=1;;i++){ // loop to demo with maximum thoughput
try (ResultSet rs = sql.executeQuery()) {
rs.next();
retries=0; // reset retries when sucessful
if (rs.getInt(2) >= 0) {
total_tokens++; // requested token was accepted
} else {
Thread.sleep(1000); // wait when tokens are exhausted
}
total_duration=Duration.between(t0,Instant.now()).toNanos()/1e9;
System.out.printf(
"(pid@host %12s) %6d calls %6d tokens %8.1f /sec %5d remaining\n"
,rs.getString(1),i,total_tokens,(total_tokens/total_duration),rs.getInt(2));
} catch(SQLException e) {
if ( "40001".equals(e.getSQLState()) ) { // transaction conflict
System.out.printf(Instant.now().toString()
+" SQLSTATE %s on retry #%d %s\n",e.getSQLState(),retries,e );
if (retries < max_retry ){
Thread.sleep(50*retries);
retries=retries+1;
} else {
System.out.printf(Instant.now().toString()+" failure after #%d retries %s\n",retries,e );
System.exit(1);
}
} else {
throw e;
}
}
}
} catch(Exception e) {
System.out.printf("Failure" + e );
System.exit(1);
}
}
public static void main(String[] args) throws SQLException {
YBClusterAwareDataSource ds = new YBClusterAwareDataSource();
ds.setUrl( args[1] );
RateLimitDemo thread;
for (int i=0;i<Integer.valueOf( args[0] );i++){
thread=new RateLimitDemo(ds,args[2],
Integer.valueOf( args[3] ),Integer.valueOf( args[4] ));
thread.start();
}
}
} // RateLimitDemoThe transaction conflicts are detected by
catch(SQLException e) and "40001".equals(e.getSQLState()). A retries counter is incremented and waits Thread.sleep(50*retries). Before the maximum retries (retries < max_retry ) I display the exception and increment the retries. retries is set back to zero as soon as a call is successful. After max_retries, I stop the program (System.exit(1);).First, I've run it on PostgreSQL (Amazon RDS db.m5.xlarge with no HA). I changed two things in the previous java code.
setTransactionIsolation line commented outselect pg_backend_pid()||?||host(inet_server_addr()) ,rate_limiting_token_bucket_request(?||pg_backend_pid()::text,?)
I've run this over the night to be sure that throughput is constant:
javac RateLimitDemo.java && java RateLimitDemo 50 "jdbc:yugabytedb://database-1.cvlvfe1jv6n5.eu-west-1.rds.amazonaws.com/postgres?user=postgres&password=Covid-19" "user2" 1000 20 | awk 'BEGIN{t=systime()}/remaining$/{c=c+1;p=100*$5/$3}NR%100==0{printf "rate: %8.2f/s (last pct: %5.2f) max retry:%3d\n",c/(systime()-t),p,retry}/retry/{sub(/#/,"",$6);if($6>retry)retry=$6}'This runs 50 threads with a high limit per user (1000 tokens per second) to show the maximum throughput without contention:
The awk script sums the tokens acquired, to display the actual rate, show percentage of successful calls and maximum number of retries encountered:
rate:   999.29/s (last pct: 100.00) max retry:  0
rate:  1000.00/s (last pct: 100.00) max retry:  0
rate:  1000.71/s (last pct: 100.00) max retry:  0
rate:  1001.42/s (last pct: 100.00) max retry:  0
rate:  1002.13/s (last pct: 100.00) max retry:  0
rate:   995.77/s (last pct: 100.00) max retry:  0
rate:   996.48/s (last pct: 100.00) max retry:  0
rate:   997.18/s (last pct: 100.00) max retry:  0
rate:   997.89/s (last pct: 100.00) max retry:  0
rate:   998.59/s (last pct: 100.00) max retry:  0
rate:   999.30/s (last pct: 100.00) max retry:  0
rate:  1000.00/s (last pct: 100.00) max retry:  0
rate:  1000.70/s (last pct: 100.00) max retry:  0
rate:  1001.41/s (last pct: 100.00) max retry:  0
rate:  1002.11/s (last pct: 100.00) max retry:  0
I've run this on AWS RDS to get the Performance Insight view.
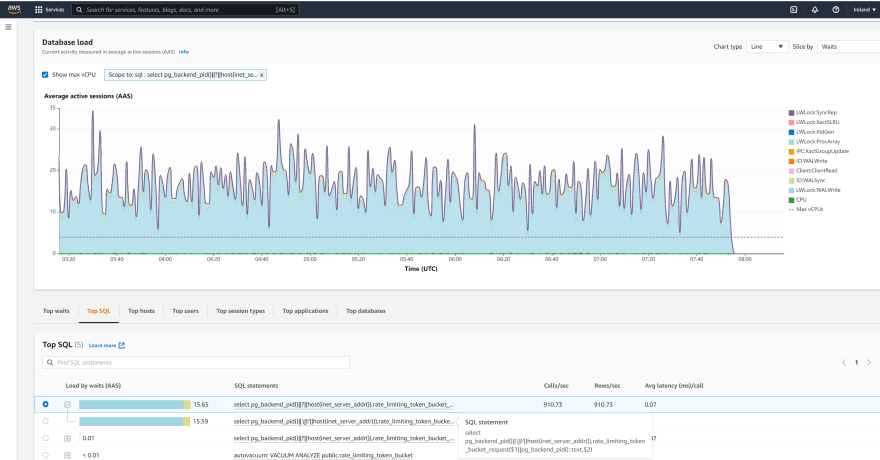
About 1000 autocommit updates per second:

From my 50 threads doing those single-row calls, an average of 15 are active in database, mostly waiting on WALWrite.
The numbers match what I display: 100 transaction commit per second, 1000 tuples fetched and 1000 rows updated. However I have some doubts about the relevance of displaying those statistics which depend on the access path. For example I have 1000 tup_fetched (index access) but 2000 tup_returned (because of UPDATE ... RETURNING I guess)

There is no contention so the main bottleneck is on keeping up writing WAL. PostgreSQL generates a lot of WAL, even for a single counter + timestamp update, because the whole tuple is inserted, the old one marked as previous version, index updates, and all this with full page logging. And this, with no multi-AZ configuration for HA.
I've run the same in Serializable isolation level:
rate:   929.99/s (last pct: 100.00) max retry:  4
rate:   930.24/s (last pct: 100.00) max retry:  4
rate:   930.50/s (last pct: 100.00) max retry:  4
rate:   930.75/s (last pct: 100.00) max retry:  4
rate:   931.01/s (last pct: 100.00) max retry:  4
rate:   931.26/s (last pct: 100.00) max retry:  4
rate:   931.51/s (last pct: 100.00) max retry:  4
rate:   931.77/s (last pct: 100.00) max retry:  4
rate:   932.02/s (last pct: 100.00) max retry:  4
rate:   929.91/s (last pct: 100.00) max retry:  4
rate:   930.16/s (last pct: 100.00) max retry:  4
rate:   930.42/s (last pct: 100.00) max retry:  4
rate:   930.67/s (last pct: 100.00) max retry:  4
rate:   930.93/s (last pct: 100.00) max retry:  4
The throughput is nearly the same and the number or retries was very small. This post is about performance. I'll write another post about the two isolation levels and which anomalies we can get in PostgreSQL or YugabyteDB with this "token bucket" algorithm.
Now I want to test a race condition where all threads request a token for the same id. I wasn't sure about a real case of it, until a discussion with Adrian:

Adrian Dozsa
@adriandozsa

@FranckPachot @Yugabyte No right or wrong, just different use cases. I was thinking of a rate limiter for a SaaS service that can have high parallelism even per tenant.
01:05 AM - 05 Jan 2022
The rate has decreased a lot here:
rate:   124.85/s (last pct: 100.00) max retry:  0
rate:   124.78/s (last pct: 100.00) max retry:  0
rate:   124.71/s (last pct: 100.00) max retry:  0
rate:   124.63/s (last pct: 100.00) max retry:  0
rate:   124.56/s (last pct: 100.00) max retry:  0
rate:   124.49/s (last pct: 100.00) max retry:  0
rate:   124.42/s (last pct: 100.00) max retry:  0
rate:   124.35/s (last pct: 100.00) max retry:  0
rate:   124.28/s (last pct: 100.00) max retry:  0
rate:   124.21/s (last pct: 100.00) max retry:  0
rate:   124.14/s (last pct: 100.00) max retry:  0
rate:   124.07/s (last pct: 100.00) max retry:  0
rate:   124.00/s (last pct: 100.00) max retry:  0
rate:   123.93/s (last pct: 100.00) max retry:  0
rate:   123.86/s (last pct: 100.00) max retry:  0
rate:   123.80/s (last pct: 100.00) max retry:  0
rate:   123.73/s (last pct: 100.00) max retry:  0
rate:   123.66/s (last pct: 100.00) max retry:  0
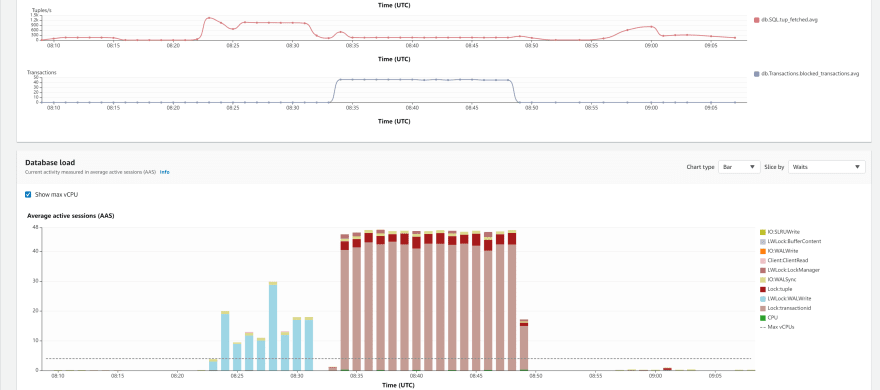
Now the bottleneck is tuple lock because all threads compete to update the row, with
Lock:tuple and Lock:transactionid because when a row is locked we have to wait for the transaction that locked it. 45 sessions waiting on average: all my threads are waiting for only 5 doing calls:
Now I'l run the exact program I've put above, updating the same row in Serializable mode. I have reduced the number of threads from 50 to 10 because the number of maximum retries were immediately reached. Anyway, the throughput from 10 threads is better than with the 50 ones in Read Commited:
rate:   218.48/s (last pct: 83.85) max retry:  5
rate:   217.19/s (last pct: 81.35) max retry:  5
rate:   217.39/s (last pct: 85.39) max retry:  5
rate:   217.78/s (last pct: 83.48) max retry:  5
rate:   218.07/s (last pct: 85.09) max retry:  5
rate:   218.37/s (last pct: 84.04) max retry:  5
rate:   218.70/s (last pct: 81.29) max retry:  5
rate:   217.47/s (last pct: 83.84) max retry:  5
rate:   217.82/s (last pct: 85.12) max retry:  5
rate:   218.06/s (last pct: 85.36) max retry:  5
rate:   218.44/s (last pct: 85.13) max retry:  5
rate:   218.65/s (last pct: 83.54) max retry:  5
rate:   217.31/s (last pct: 82.77) max retry:  5
rate:   217.64/s (last pct: 81.35) max retry:  5
rate:   217.82/s (last pct: 83.88) max retry:  5
With 7% of retries, I don't think it makes sense to run more threads. I've seen nothing in Performance Insight about this: bottleneck. This run was just after the previous one:

With Read Committed pessimistic locking, the 50 sessions waiting were visible in

With Read Committed pessimistic locking, the 50 sessions waiting were visible in
Lock wait events and in transactions blocked statistics but here, where I know I have a lot of retries, I see nothing visible in those metrics.By the way, my awk script hides it but the retries raise as SQL State 40001:
(pid@host 17774@172.31.24.228)    579 calls    471 tokens     22.2 /sec 60000 remaining
(pid@host 17780@172.31.24.228)    544 calls    454 tokens     22.2 /sec 60000 remaining
(pid@host 17726@172.31.24.228)    655 calls    562 tokens     23.1 /sec 60000 remaining
2022-01-05T09:13:28.809161Z SQLSTATE 40001 on retry #0 com.yugabyte.util.PSQLException: ERROR: could not serialize access due to concurrent update
  Where: SQL statement "update rate_limiting_token_bucket
     set ts=now(), tk=greatest(least(
      tk-1+refill_per_sec*extract(epoch from clock_timestamp()-ts)
      ,window_seconds*refill_per_sec),-1)
     where rate_limiting_token_bucket.id=rate_id
     returning tk"
PL/pgSQL function rate_limiting_token_bucket_request(text,integer,integer) line 7 at SQL statement
2022-01-05T09:13:28.815876Z SQLSTATE 40001 on retry #1 com.yugabyte.util.PSQLException: ERROR: could not serialize access due to concurrent update
  Where: SQL statement "update rate_limiting_token_bucket
     set ts=now(), tk=greatest(least(
      tk-1+refill_per_sec*extract(epoch from clock_timestamp()-ts)
      ,window_seconds*refill_per_sec),-1)
     where rate_limiting_token_bucket.id=rate_id
     returning tk"
PL/pgSQL function rate_limiting_token_bucket_request(text,integer,integer) line 7 at SQL statement
(pid@host 17786@172.31.24.228)    565 calls    471 tokens     23.9 /sec 60000 remaining
(pid@host 17721@172.31.24.228)    739 calls    636 tokens     25.4 /sec 60000 remaining
I've run this in Amazon RDS because a managed service is easy to provision and monitor, but all this is the same as vanilla PostgreSQL. AWS changes only little things to the postgres code, to cope with the cloud security model. I've used the YugabyteDB JDBC driver so you can guess what I'll run in the next post 🤔
What is important to remember is that, for this workload, the default Read Committed or Serializable have good performance without contention on the same rows. You may think that Read Committed is easier because there are no retries, but this is because I'm running on existing rows. The UPDATE-then-INSERT will always need retry because they can encounter a
duplicate key. I'll detail that in another post. For this Token Bucket algorithm, Serializable is more appropriate, especially with high probability of contention.32


