21
SLOB on YugabyteDB
I see many people using benchmarks that simulate an application (like TPC-C) for everything and I tried to explain in a past blog post why I don't think it is the right approach when you want to compare different platforms (disks, processors, storage engine release...). Basically, when your goal is to understand where the bottleneck is, and what you can improve, you should:
- know exactly what you run, and homogeneously, so that metrics, which are samples or averages, are still relevant
- measure all the metrics related with what you run, so that you can get the full picture
If my workload is a combination of client-server calls, query parsing, system calls, result processing,... how can I know exactly what I am measuring?
You need to stress the component you want to analyze, exactly like your doctor will ask you to breath strongly when listening to your lungs, you cardiologist will ask you to do a few squats before looking at your heart,... He can not do that on your normal activity. PGIO is the tool when it comes to measure the maximum LIOPS (Logical I/O per second) or PIOPS (Physical I/O per second) on PostgreSQL. You define what you want to measure. Read-only with PCT_UPDATE=0, or some writes with a percentage of updates. You run in memory only with SCALE < shared_buffers, or filesystem cache with a SCALE between PG buffers and OS available RAM. Or disk I/O with larger SCALE.
As YugabyteDB is PostgreSQL compatible, you can run PGIO. However, there are a few things to consider given the different storage layer.
PGIO is a project from Kevin Closson, author of the SLOB method.
git clone https://github.com/therealkevinc/pgio.git
tar -zxvf pgio/pgio*.tar.gzPGIO drops the tables with a loop on {1..8192}. This is fast in PostgreSQL but, in a distributed database, the catalog is shared and running a thousand of DDL is long. I change it to drop only the tables I'll create (from NUM_SCHEMAS):
grep -C3 "DROP TABLE" pgio/setup.sh
sed -ie 's/for i in {1..8192}/for i in {1..$NUM_SCHEMAS}/' pgio/setup.sh
grep -C3 "DROP TABLE" pgio/setup.shPGIO for PostgreSQL, as SLOB for Oracle, are designed for Heap Tables where the rows are stored as loaded, and the primary key is just an index that references the physical location (ctid for PostgreSQL and rowid for Oracle). The SLOB method uses this property to read a batch (the WORK_UNIT parameter in pgio.conf) of random rows without doing a loop in the procedural language. As the tables are created with the worst correlation factor on "mykey", thanks to the order by on the random "scratch" during the generation of rows, this guarantees random reads scattered through the whole set of rows that can be read (the SCALE parameter of pgio.conf).
With YugabyteDB, the tables are stored in the index structure of their primary keys (the equivalent of partitioned index-organized table in Oracle, or clustered index in SQL Server, or InnoDB table in MySQL...). However, in YB this is not a B*Tree but LSM and you have the choice to partition it by range of hash. When not specifying a primary key, a UUID is generated and hash sharding is used. I'll keep this for my PGIO tables as it creates an index on "mykey" after the create table. However, the default is hash partitioning and I want a range scan, so I change the CREATE INDEX to include the ASC keyword:
grep -C3 "create index" pgio/setup.sh
sed -ie '/^create index/s/mykey/& asc/' pgio/setup.sh
grep -C3 "create index" pgio/setup.sh
The CREATE INDEX syntax is in the YugabyteDB documentation
The SLOB method on heap tables ensures that there is only one row per block so that one row read is one block read (Logical IO which can also be a Physical IO in case of cache miss). We don't have that here in YugabyteDB as the storage is a document store (DocDB). However, the FILLFACTOR is ignored so I just leave it there.
I'll create only 1 table (the NUM_SCHEMAS parameter) with a scale of 1 million rows (remember, we are talking about rows here, not blocks). This is the SCALE parameter. Each loop will range scan from the index in order to get 1000 rows (the WORK_UNIT parameter). And this will run for 1000 seconds (the RUN_TIME parameter). Here are my settings:
echo "UPDATE_PCT=0 RUN_TIME=1000 NUM_SCHEMAS=1 NUM_THREADS=1 WORK_UNIT=1000 UPDATE_WORK_UNIT=8 SCALE=1000000 DBNAME=yugabyte CONNECT_STRING='postgres://yugabyte:yugabyte@yb1.pachot.net:5433/yugabyte' CREATE_BASE_TABLE=TRUE" > pgio/pgio.conf
. pgio/pgio.conf
psql "$CONNECT_STRING" <<< "select version();"
A large WORK_UNIT is important there because I am measuring the storage layer here, and then minimize the work done in the query layer.
I'm running this connected to one node (the IP address mentioned in CONNECT_STRING)
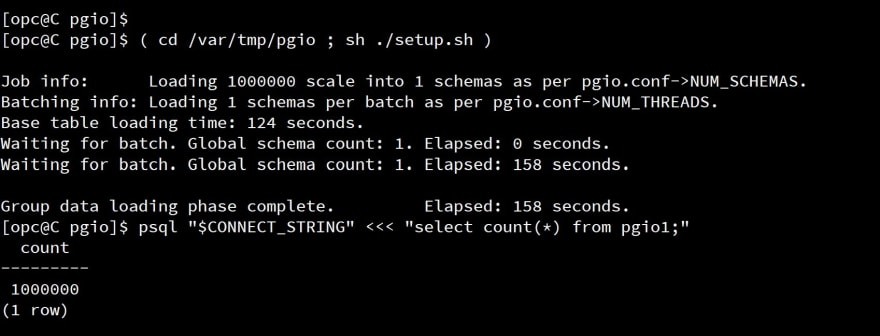
( cd pgio ; sh ./setup.sh )
psql "$CONNECT_STRING" <<< "select count(*) from pgio1;"
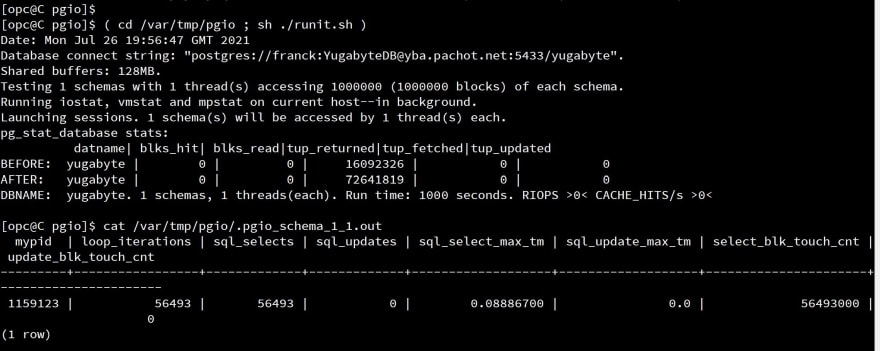
With the configuration above, I'll run with one session on one schema only, no updates, and for a duration of 1000 seconds:
( cd pgio ; sh ./runit.sh )
cat /var/tmp/pgio/.pgio_schema_1_1.out
The metrics displayed by PGIO, coming from pg_stat_database, are not relevant here because YugabyteDB storage is out of the PostgreSQL code. But the .pgio_schema_1_1.out has some relevant numbers returned from the mypgio() function:

The program is all running as a PL/pgSQL function in order to avoid client-server calls. it reads WORK_UNIT rows with a SELECT ... BETWEEN starting at random within the SCALE rows. During those 1000 seconds we have run loop_iterations=56493 with only SELECT statements, so sql_selects=56493, each reading WORK_UNIT=1000 rows, which means in total select_blk_touch_cnt=56493000 rows. This means 56493 rows per second, with only one session, executing 56 select statement per second.
Note that SLOB on ORACLE or PGIO on PostgreSQL run on dedicated session processes and then one run is one task on the database server. This makes it easy to verify if the workload is the one we expected: one process 100% in CPU if we are doing Logical IO measures. YugabyteDB is a distributed database where multiple nodes are running, with multiple threads. So you can expect a load average higher than 1 even when running with NUM_SCHEMAS=1.
sql_select_max_tm is the maximum response time of the SELECT statement. 89 milliseconds here for a select that reads 1000 rows. This is on small scale - 1 million rows.
If you want a larger scale, the way setup.sh generates data, with one statement, is not adapted for this database that is optimized for OLTP. There's a default timeout to 60 seconds. Then it is better to setup with a small scale and add rows by batches:
do $$ begin for i in 1..5 loop insert into pgio1 select * from pgio_base; commit; end loop; end; $$;However, for larger workloads (with disk I/O, concurrent access), I'll write these setup.sh and runit.sh in a way that is more adapted to YugabyteDB, and probably all in PL/pgSQL.
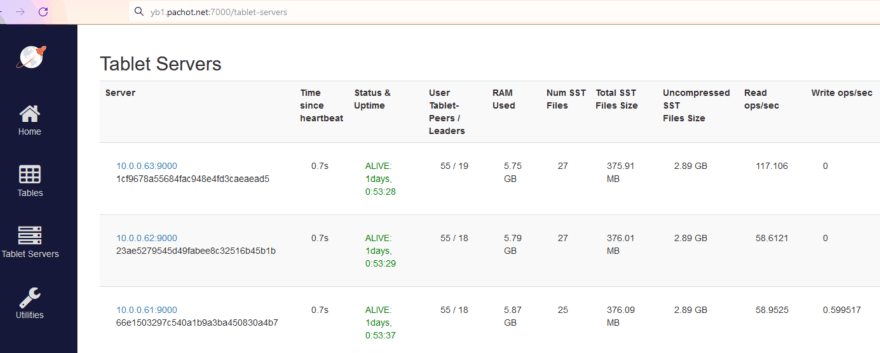
As it happens often, I re-read the blog post and have something to add. I mentioned that the rate was 56493 rows read per second, with 56 selects per second. How does it look on the Table Server's table?

What we call "Read ops/sec" and "Write ops/sec" is related to the DocDB operations. How does it map to the YSQL operations and rows? This depends on the execution plan and that is for a future blog post. Here, my table has 3 tablets with a leader on each of the 3 nodes, 10.0.0.61, 10.0.0.62, 10.0.0.63 and the index that I range scan has one tablet only with the leader on the 10.0.0.63 node. Each SELECT fetches the index entries from the index leader, and then fetches the rows from each table leader, and this is in total "4 Read ops" from the tserver statistics. Now you understand how we around 58 "Read ops/sec" per tablet, with the double for the index leader.
Note that I've created 'ybio' to run, with the same idea, on YugabyteDB or any other PostgreSQL compatible database:
https://github.com/FranckPachot/ybio
21
