27
Redis Streams in Action - Part 4 (Serverless Go app to monitor tweets processor)
Welcome to this series of blog posts which covers Redis Streams with the help of a practical example. We will use a sample application to make Twitter data available for search and query in real-time. RediSearch and Redis Streams serve as the backbone of this solution that consists of several co-operating components, each of which will we covered in a dedicated blog post.
The code is available in this GitHub repo - https://github.com/abhirockzz/redis-streams-in-action
We will continue from where we left off in the previous blog post and see how to build a monitoring app to make the overall system more robust in the face of high load or failure scenarios. This is because our very often, data processing applications either slow down (due to high data volumes) or may even crash/stop due to circumstances beyond our control. If this happens with our Tweets processing application, the messages that were assigned to a specific instance will be left unprocessed. The monitoring component covered in this blog post, checks pending Tweets (using XPENDING), claims (XCLAIM), processes (store them as HASH using HSET) and finally acknowledges them (XACK).

This is a Go application which will be deployed to Azure Functions - yes, we will be using a Serverless model, wherein the monitoring system will execute based on a pre-defined Timer trigger. As always, we will first configure and deploy it to Azure, see it working and finally walk through the code.
Before we move on, here is some background about Go support in Azure Functions.
Those who have worked with Azure Functions might recall that Go is not one of the language handlers that is supported by default. That's where Custom Handlers come into the picture.
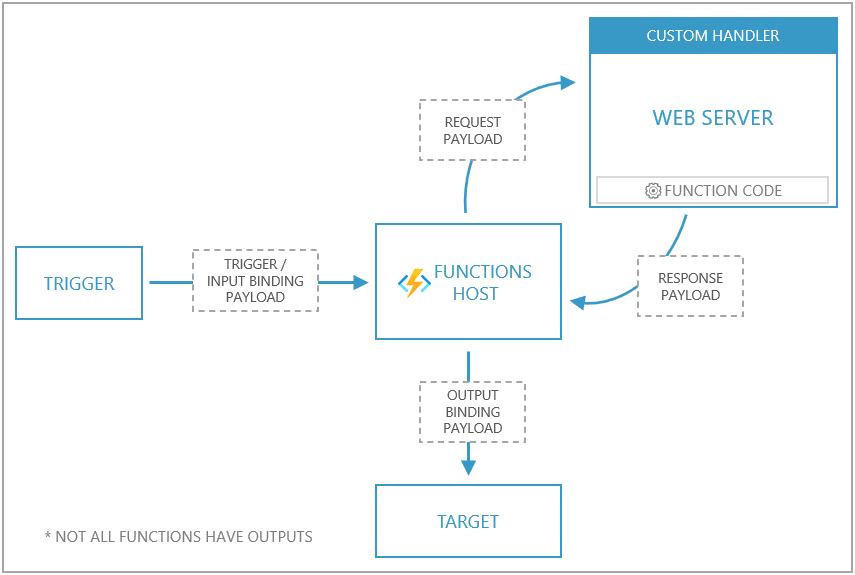
In a nutshell, a Custom Handler is a lightweight web server that receive events from the Functions host. The only thing you need to implement a Custom Handler in your favorite runtime/language is - HTTP support!
An event trigger (via HTTP, Storage, Event Hubs etc.) invokes the Functions host. The way Custom Handlers differ from traditional functions is that the Functions host acts as a middle man: it issues a request payload to the web server of the Custom Handler (the function) along with a payload that contains trigger, input binding data and other metadata for the function. The function returns a response back to the Functions host which passes data from the response to the function's output bindings for processing.
Here is a summary of how Custom Handlers work at a high level (the diagram below has been picked from the documentation)

Alright, let's move on to the practical bits now.
Please make sure that you read part 2, 3 of this series and have the respective applications up and running. Our monitoring application will build on top of the Tweets producer and processor services that you deploy.
You will need an Azure account which you can get for free and the Azure CLI. Make sure to download and install Go if you don't have it already and also install the Azure functions Core Tools - this will allow you to deploy the function using a CLI (and also run it test and debug it locally)
The upcoming sections will guide you how to deploy and configure the Azure Function.
You will:
- Create the an Azure Functions app
- Configure it
- Deploy the Function to the app that you created
Start by creating a Resource Group to host all the components of the solution.
Search for Function App in the Azure Portal and click Add

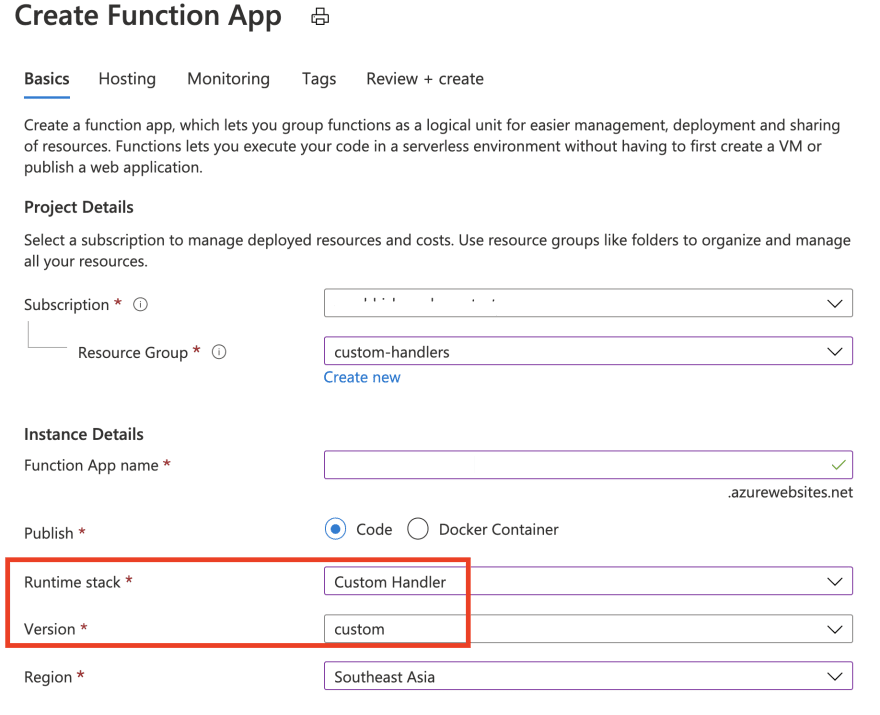
Enter the required details: you should select Custom Handler as the Runtime stack

In the Hosting section, choose Linux and Consumption (Serverless) for Operating system and Plan type respectively.

- Enable Application Insights (if you need to)

- Review the final settings and click Create to proceed

Once the process is complete, the following resource will also be created along with the Function App:
- App Service plan (a Consumption/Serverless plan in this case)
- An Azure Storage account
- An Azure Application Insights function)
Our function needs a few environment variables to work properly - these can be added as Function Configuration using the Azure portal. Here is the list:
Redis connectivity details:
-
REDIS_HOST- host and port for Redis instance e.g. myredis:10000 -
REDIS_PASSWORD- access key (password) for Redis instance
Redis Stream info:
-
STREAM_NAME- the name of the Redis Stream (usetweets_streamas the value) -
STREAM_CONSUMER_GROUP_NAME- name of the Redis Streams consumer group (useredisearch_app_groupas the value)
Monitoring app metadata:
-
MONITORING_CONSUMER_NAME- name of the consumer instance represented by the monitoring app (it is part of the aforementioned consumer group) -
MIN_IDLE_TIME_SEC- only pending messages that are older than the specified time interval will be claimed

First, clone the GitHub repo and build the function:
git clone https://github.com/abhirockzz/redis-streams-in-action
cd redis-streams-in-action/monitoring-app

GOOS=linux go build -o processor_monitor cmd/main.go
GOOS=linuxis used to build aLinuxexecutable since we chose aLinuxOS for our Function App
To deploy, use the Azure Functions core tools CLI:
func azure functionapp publish <enter name of the Azure Function app>Once completed, you should see the following logs:
Getting site publishing info...
Uploading package...
Uploading 3.71 MB [###############################################################################]
Upload completed successfully.
Deployment completed successfully.
Syncing triggers...
Functions in streams-monitor:
    monitor - [timerTrigger]
You should see the function in the Azure portal as well:

The function is configured to trigger every 20 seconds (as per function.json):
{
    "bindings": [
        {
            "type": "timerTrigger",
            "direction": "in",
            "name": "req",
            "schedule": "*/20 * * * * *"
        }
    ]
}As before, can introspect the state of our system using redis-cli - execute the XPENDING command:
XPENDING tweets_stream redisearch_app_groupYou will an output similar to this (the numbers will differ in your case depending on how many tweets processor instances you were running and for how long):
1) (integer) 209
2) "1620973121009-0"
3) "1621054539960-0"
4) 1) 1) "consumer-1f20d41d-e63e-40d2-bc0f-749f11f15026"
      2) "3"
   2) 1) "monitoring_app"
      2) "206"
As explained before, the monitoring app will claim pending messages which haven't been processed by the other consumers (active or inactive). In the output above, notice that the no. messages currently being processed by monitoring_app (name of our consumer) is 206 - it actually claimed these from another consumer instance(s). Once these messages have been claimed, their ownership moves from their original consumer to the monitoring_app consumer.
You can check the same using
XPENDING tweets_stream redisearch_app_groupagain, but it might be hard to detect since the messages actually get processed pretty quickly.
Out of the 206 messages that were claimed, only the ones that have not being processed in the last 10 seconds (this is the MIN_IDLE_TIME_SEC we had specified) will be processed - others will be ignored and picked up in the next run by XPENDING call (if they are still in an unprocessed state). This is because we want to give some time for our consumer application to finish their work - 10 seconds is a pretty generous time-frame for the processing that involves saving to HASH using HSET followed by XACK. .
Please note that the 10 second time interval used above has been used as example and you should determine these figures based on the end to end latencies required for your data pipelines/processing.
You have complete flexibility in terms of how you want to run/operate such a "monitoring" component. I chose a serverless function but you could run it as standalone program, as a scheduled Cron job or even as a Kubernetes Job!
Don't forget to execute RediSearch queries to validate that you can search for tweets based on multiple criteria:
FT.SEARCH tweets-index hello
FT.SEARCH tweets-index hello|world
FT.SEARCH tweets-index "@location:India"

FT.SEARCH tweets-index "@user:jo* @location:India"
FT.SEARCH tweets-index "@user:jo* | @location:India"

FT.SEARCH tweets-index "@hashtags:{cov*}"
FT.SEARCH tweets-index "@hashtags:{cov*|Med*}"
Now that we have seen things in action, let's explore the code.
Please refer to the code on GitHub
The app uses the excellent go-redis client library. As usual, it all starts with connecting to Redis (note the usage of TLS):
client := redis.NewClient(&redis.Options{Addr: host, Password: password, TLSConfig: &tls.Config{MinVersion: tls.VersionTLS12}})

    err = client.Ping(context.Background()).Err()
    if err != nil {
        log.Fatal(err)
    }
Then comes the part where bulk of the processing happens - think of it as workflow with sub-parts:
We call XPENDING to detect no. of pending messages e.g. XPENDING tweets_stream group1
numPendingMessages := client.XPending(context.Background(), streamName, consumerGroupName).Val().CountTo get the pending messages, we invoke a different variant of XPENDING, to which we pass on the no. of messages we obtained in previous call
xpendingResult := client.XPendingExt(context.Background(), &redis.XPendingExtArgs{Stream: streamName,Group: consumerGroupName, Start: "-", End: "+", Count: numPendingMessages})We can now claim the pending messages - the ownership of these will be changes from the previous consumer to the new consumer (monitoringConsumerName) whose name we specified
xclaim := client.XClaim(context.Background(), &redis.XClaimArgs{Stream: streamName, Group: consumerGroupName, Consumer: monitoringConsumerName, MinIdle: time.Duration(minIdleTimeSec) * time.Second, Messages: toBeClaimed})Once the ownership is transferred, we can process them. This involves, adding tweet info to HASH (using HSET) and acknowledging successful processing (XACK). goroutines are used to keep things efficient for e.g. if we get 100 claimed messages in a batch, a scatter-gather process is folloeed where a goroutine is spawned to process each of these message. A sync.WaitGroup is used to "wait" for the current batch to complete before looking for next set of pending messages (if any).
for _, claimed := range xclaim.Val() {
            if exitSignalled {
                return
            }
            waitGroup.Add(1)

            go func(tweetFromStream redis.XMessage) {
                hashName := fmt.Sprintf("%s%s", indexDefinitionHashPrefix, tweetFromStream.Values["id"])

                processed := false
                defer func() {
                    waitGroup.Done()
                }()

                err = client.HSet(context.Background(), hashName, claimed.Values).Err()

                if err != nil {
                    return // don't proceed (ACK) if HSET fails
                }

                err = client.XAck(context.Background(), streamName, consumerGroupName, tweetFromStream.ID).Err()
                if err != nil {
                    return
                }
                processed = true
            }(claimed)
        }
        waitGroup.Wait()
Before we dive into the other areas, it might help to understand the nitty gritty by exploring the code (which is relatively simple by the way)
Here is how the app is setup (folder structure):
.
├── cmd
│   └── main.go
├── monitor
│   └── function.json
├── go.mod
├── go.sum
├── host.json
host.json tells the Functions host where to send requests by pointing to a web server capable of processing HTTP events. Notice the customHandler.description.defaultExecutablePath which defines that processor_monitor is the name of the executable that'll be used to run the web server.
{
    "version": "2.0",
    "extensionBundle": {
        "id": "Microsoft.Azure.Functions.ExtensionBundle",
        "version": "[1.*, 2.0.0)"
    },
    "customHandler": {
        "description": {
            "defaultExecutablePath": "processor_monitor"
        },
        "enableForwardingHttpRequest": true
    },
    "logging": {
        "logLevel": {
            "default": "Trace"
        }
    }
}this brings us to the end of this blog series. let's recap what we learnt:
- In the first part you got an overview of the use case, architecture, it's components, along with an introduction to Redis Streams and
RediSearch. It setup the scene for rest of the series. - Part two dealt with the specifics of the Rust based tweets consumer app that consumed from the Twitter Streaming API and queued up the tweets in Redis Streams for further processing.
- Third part was all about the Java app that processed these tweets using by leveraging the Redis Streams Consumer Group feature and scaling out processing across multiple instances.
- ... and final part (this one) was all about the Go app to monitor tweets that have been abandoned (in the pending entry list) either due to processing failure or consumer instance failure.
I hope you found this useful and apply it to building scalable solutions with Redis Streams. Happy coding!
27
