
27
Explore Geopolitical data from GDELT
In this blog, we will explore the geopolitical data from GDELT and see how that data can be used in the analysis.
The GDELT Project created by Kalev H. Leetaru monitors the world's news from every country in over 100 languages and identifies the people, locations, organizations, themes, sources, emotions, counts, quotes, images, and events driving our global society.
In this blog, we will have a look at the Events database of GDELT and how this data can be used for analysis.
The GDELT Event Database catalog over 20 main categories and more than 300 subcategories. Each category is given a particular cameo code. We will be looking into the 20 main cameo codes. That includes
- Make Public Statement
- Appeal
- Express intent to cooperate
- Consult
- Engage in diplomatic cooperation
- Engage in material cooperation
- Provide aid
- Yield
- Investigate
- Demand
- Disapprove
- Reject
- Threaten
- Protest
- Exhibit military posture
- Reduce relations
- Coerce
- Assault
- Fight
- Use unconventional mass violence
Let's see how we can get the data for these events for all countries.
- BigQuery You can query any data you want according to your need. Here is an example of a query.
select SQLDATE,EventRootCode,Actor1CountryCode,NumMentions from gdeltv2.events;-
Using gdelt python package
- Installation:
pip install gdelt - Call the gdelt version 2 database.
- Installation:
gd2 = gdelt.gdelt(version=2)- Use gd2 object to search for the data of a given date and set table to events.
results = gd2.Search(['2020-01-01'],table='events',coverage=True)- Load the data into the notebook.
df = pd.read_csv("gdelt.csv");- The data output of the gdelt object has all the columns present in the events database. Now filter it to the columns necessary, i.e., SQLDATE, EventRootCode, Actor1CountryCode, NumMentions
results = results[['SQLDATE','EventRootCode','NumMentions','Actor1CountryCode']]- Convert the SQLDATE format from 'YYYYMMDD' to 'YYYY-MM-DD'.
results['SQLDATE'] = results['SQLDATE'].apply(lambda x: pd.to_datetime(str(x), format='%Y-%m-%d'))- Aggregate the data based on SQLDATE, EventRootCode, and Actor1CountryCode.
results = results.groupby(['SQLDATE','EventRootCode','Actor1CountryCode']).agg('sum').reset_index()Mapping a Line Chart of a particular Cameo code for the country over time.
Example: Protest in USA (Aggregated to Weekly basis)

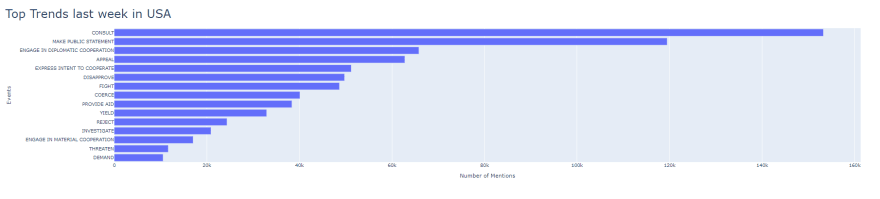
Mapping Top Cameo codes in a country based on the Number of Mentions of the particular cameo code.
Example: Top Trends in USA (Last Week)
Mapping Top Countries in a particular cameo code based on the Number of Mentions of the particular cameo code in the country.
Example: Top Countries in Protest (Last Week)

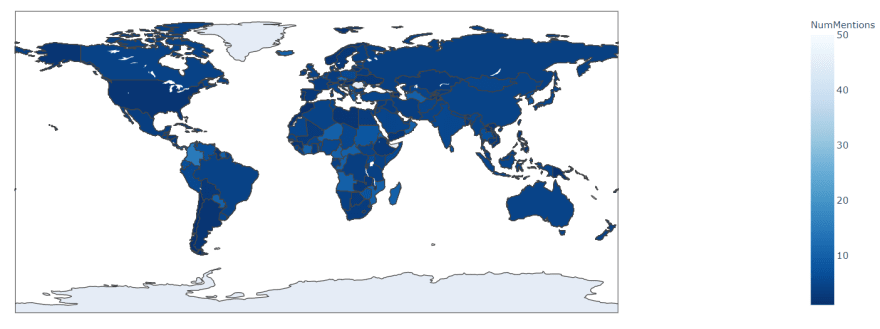
Plot a choropleth map for a particular cameo code.
Example: Protest (Today)
- Python
- Pandas
- Plotly
Code: Link
Co-author: @ashishsalunkhe
27