13
A crash course in React.js and D3
I created a crash course type video on using D3 and React.js. You can see the video here.
For most use cases involving creation of standard charts, D3 is not practical, because of the complex nature of the API. In this post I try to explain scenarios where you would use D3 with React.js rather than use easier chart libraries like Recharts or the ones mentioned in one of my previous post :
These libraries do a really good job of creating simple line charts like the one in my video. They are much easier to use and provide really good features out the box. I would recommend that for most use cases, where the visual and interaction requirements are not that complex then you should use those suggested in my previous post. (You can also got to the end and check out my videos on Recharts and react-chartJs if you are not interested in D3.js)
At the end of this post, I will recommend other resources that will get you started with D3 if you think D3 will be a good fit for your next project or side project.
First lets look at what the D3.js website says about D3.js:
D3.js is a JavaScript library for manipulating documents based on data. D3 helps you bring data to life using HTML, SVG, and CSS. D3’s emphasis on web standards gives you the full capabilities of modern browsers without tying yourself to a proprietary framework, combining powerful visualization components and a data-driven approach to DOM manipulation.
So what they are talking about is data visualisation. D3.js is not really a dedicated charting library but a set of visualization and DOM manipulation components. These components will help you build visually stunning data visualisations with custom interactive features. Two of the most appealing things about D3.js is that It has some great animation features and it has its own Dom manipulation capability. Take a look at the graphics capability from these two examples.

You can see the code for this at https://bl.ocks.org/mbostock/1345853

You can see the code for this d3 morphing animation at https://bl.ocks.org/mbostock/3916621
In D3 you manipulate low level Dom elements and deal with SVG canvas drawing concepts. This has a drawback because it requires a bit of a learning curve to get your head around the query type structure of the D3 method chaining. And then there are the scale functions that map your data onto an SVG canvas, this involves a little bit of head maths. So the overhead of learning D3 is a bit too much just to create standard charts
To summarize, you should use D3 for the following reasons:
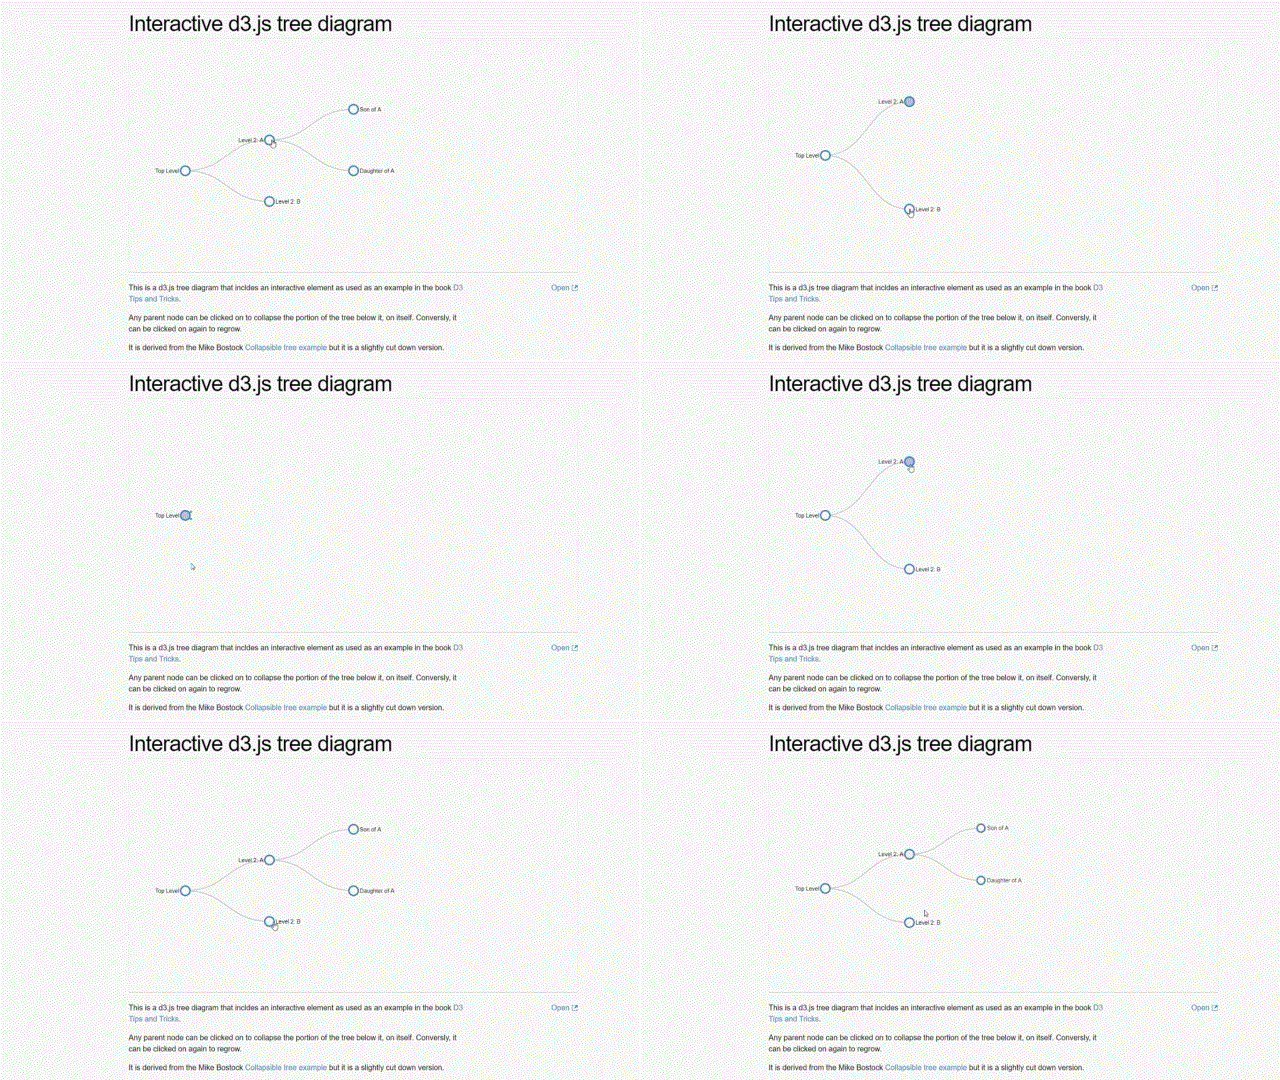
An example of a visualisation that will be ideal to create in D3 would to build an animated tree chart like this:

You can see the code for this here https://bl.ocks.org/d3noob/8375092.
I would recommend starting of with a line chart and then progress to add other interactive and animation features. This is why I created this video.
Be warned this is a bit of a crash course, so would be suitable for someone who has fairly good grasp of react and JavaScript. But if you want to familiarize the basic concepts of D3 then check out the next section. In my video I cover the following :
Installing React.js with D3
Setup your data in React.js
Setup JSX with SVG canvas and learn how to draw basic line in SVG
Setting up and testing scale functions so that you can map your data onto the SVG canvas. The two scale functions you learn are :
d3.scalePoint // You use this if your dealing with any data that is ordinal by nature, ie categories of things or days of the week (Monday, Tuesday, Wednesday) etc
d3.scaleLinear // You use this to map values that are numerical, continuous and can be measured.
Use the d3.line function to generate a setup commands to draw the line curve.
Use the d3.select and d3.selectAll components manipulate DOM elements. - You can add/remove and change attributes. You would use this to draw things in svg too.
Learn how to generate and draw X and Y axis with labels
using axis components d3.axisBottom and d3.axisLeft
A blog post on React and D3 is a good place to start by Amelia Wattenberger. This post covers the basics and touches on other complex visualisations involving maps.
Amelia's blog also has a Visualization of the whole D3 libary. This is a very useful learning tool will allow you to dig deeper into the D3 api.
A site called d3-graph-gallery has some good basic guides but it does not have any React.js examples.
If you think that D3 is not going to be suitable for your needs, then check out my popular React chart videos on Recharts and react-chartjs-2.
13

