28
Why Is Website Performance Important And Tricks To Improve Front End Performance
The performance of your website is important for accessibility and for other metrics that serve the goals of an organization or business. Web performance has a direct correlation to user experience, as well as the overall effectiveness of your site. A slow website can deter users and drive them to your competition. With this fast-evolving consumer behavior, one cannot risk overlooking the importance of website speed. You should care about web performance.
Millions of different websites are browsed every day, and half of them users close in a few seconds without giving them a possibility to impress, share the content, or sell the goods they advertise. Why does it happen so? A big percentage of websites are sluggish, user-unfriendly, and browser-incompatible. Modern users are unlikely to spend their time on slow loading pages or poorly optimized websites. In the context of web services, such problems relate to poor front-end optimization. The goal of front-end performance is to give users an ability to get what they want from a website or an application at a very limited time and ensure that they have a smooth experience while interacting with it.
Consider an example that you are running an e-commerce website. Performance is of major consideration as it is found that faster websites have lower shopping cart abandonment rates and higher conversion rates. For e-commerce websites, milliseconds in extra load time can result in loss of revenue.
Similarly, in case of content websites like wikis or blogs, audience is everything. If your website is slow it results in higher bounce rates and lower search engine ranking. Now consider an example of intranet application like timesheet or internal portal a few seconds of load time might not be a big concern.
Below are some interesting facts on business impacts and conversions:
Google has admitted that performance is one of the factors in their page rank algorithm. They recently began experimenting with red warning tags in search results, which is essentially a digital performance-based scarlet letter.

Lastly, let's consider the needs of our users and how performance fits into that.
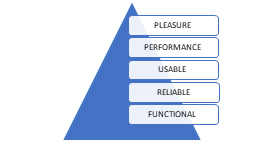
Users expect the software to be functional, reliable, usable, performant and pleasurable.
Below are a few statistics related to website speed. Hopefully this will help you understand why page speed plays an important role in meeting the website performance standards:
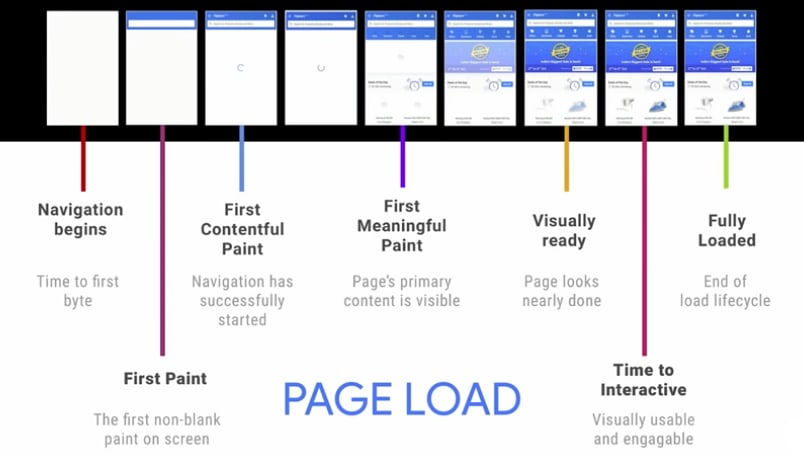
Performance metrics are the new standards of performance. There is no single metric or test that can be run on a site to evaluate how a user "feels". However, there are several metrics that can be "helpful indicators":
First paint - The time to start of first paint operation. Note that this change may not be visible; it can be a simple background color update or something even less noticeable.
First Contentful Paint (FCP) - The time until first significant rendering (e.g. of text, foreground or background image, canvas or SVG, etc.). Note that this content is not necessarily useful or meaningful.
First Meaningful Paint (FMP) - The time at which useful content is rendered to the screen.
Largest Contentful Paint (LCP) - The render time of the largest content element visible in the viewport.
Speed index - Measures the average time for pixels on the visible screen to be painted.
Time to interactive - Time until the UI is available for user interaction (i.e. the last long task of the load process finishes).
There are plenty of front-end performance tools out there (free and subscription-based) which allow you to audit the performance of your website and collect metrics covered in the previous section. Below are two tools I have used and highly recommend.
1) LIGHTHOUSE:
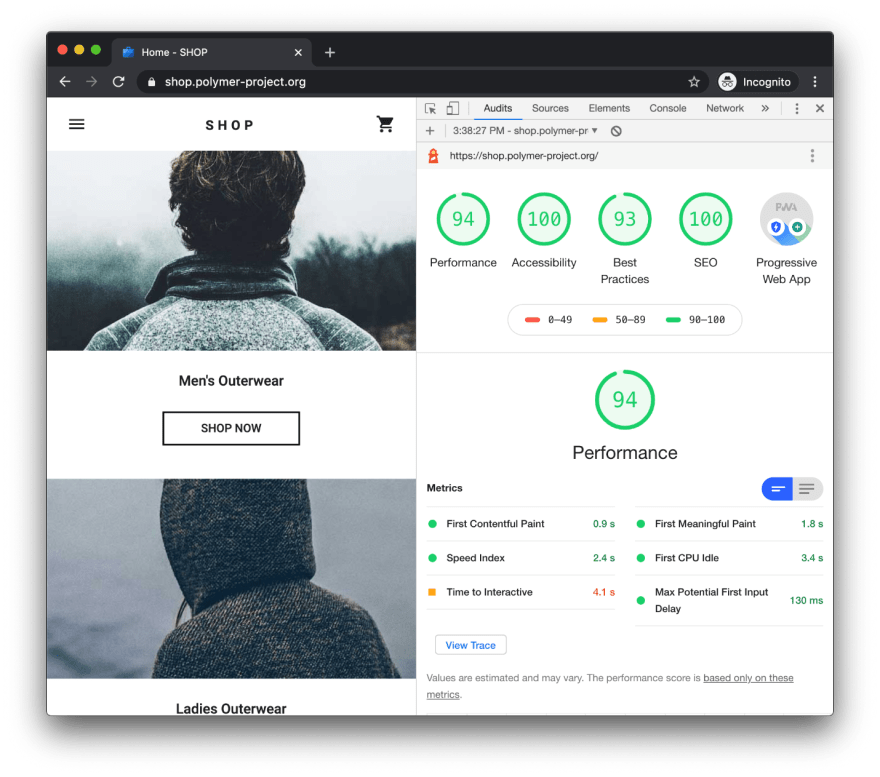
Google Lighthouse is a tool with which you can perform an audit on your website. You can use it as a simple Google Chrome extension or together with Chrome DevTools (this is a collection of web developer tools, directly in Chrome).
2) WEB PAGE TEST:
WebPageTest.org is an open-source website performance testing tool that allows you to benchmark your website from one of their 40 locations and a wide range of devices. You can also choose to simulate your tests over a slow mobile network or a fast 4G network. The result will be graded from F to A and will include information on compression, time to first byte (TTFB), caching, waterfall charts for the resources load speed and more.
It also features an option where it can run a test 3 times and display all three data sets. This helps figure out if the DNS or CDN might cause any delay and if the server can respond to all requests.
It’s a great tool to get results on how your website is performing. It gives a detailed report and insights on several metrics and provides waterfall graph. We can monitor for trends and spikes. The waterfall chart gives insight into how assets and XHR calls are loading. Once we get the report, we can prioritize the impact and work towards addressing any issues.
URL: webpagetest.org

3) GTmetrix
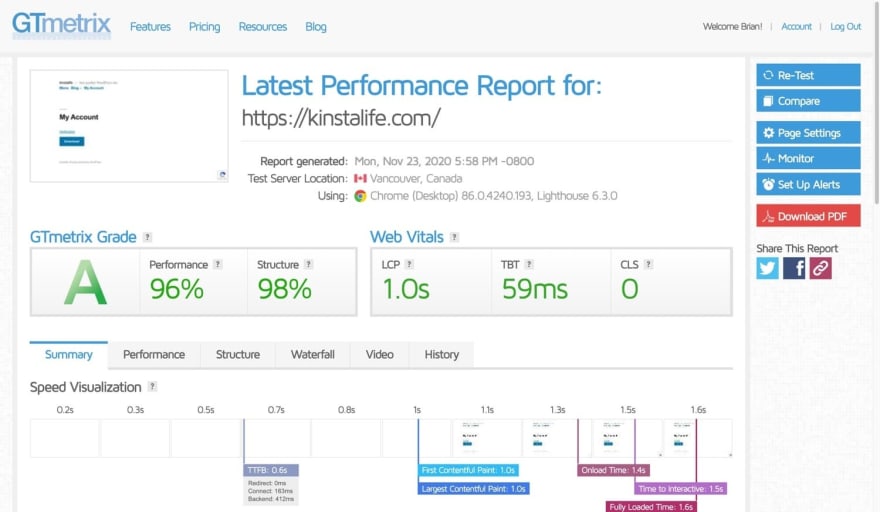
GTmetrix allows you to get detailed information on your page speed, timings, performance score, and much more. GTmetrix also provides information about how to fix the issues that were exposed by the test.
Without registering you can only run a test from one location Vancouver, Canada but after you sign up for a free account you’ll get to choose your location, different browsers, and even the connection type. This should paint a better picture of how your website works in different scenarios.
There are several other open source and paid tools that can be used to measure performance. Here is a link that provides details of those - https://sematext.com/blog/website-performance-speed-test-tools/#toc-3-google-pagespeed-insights-8
This blog reveals front-end performance optimization tips that will definitely be useful to drastically improve front-end performance and enhance website speed to make sure the users won’t cut short their visit.
1) Minification Minification removes unnecessary characters from a file to reduce its size, thereby improving load times. When a file is minified, comments and unnecessary white space characters (space, newline, and tab) are removed. This improves response time since the size of the download is reduced.
2) Image Optimization Images take up approximately 51% of the average web page size which can make websites heavy and slow. To reduce the image delivery time and boost the performance of a website, we recommend using responsive images. Responsive image techniques namely srcset, sizes, and elements allow the delivery of different scaled images based on the size and resolution of the accessing device. Check waterfall and identify ‘heavy’ assets taking the longest to load. Optimize the assets by compressing images and use of “srcset” attribute. WebP formatted images are approximately up to 30% smaller than JPEG and 25% smaller than PNG formatted images. Simply put, just converting the image into WebP format can significantly decrease the size of the web page. Just bear in mind that WebP format is not supported by Safari and iOS Safari.
3) Reduce number of requests Latency has a substantial impact on mobile application performance. Reducing the number of unique objects on the page will help reduce sensitivity to latency. Waterfall of network requests shows various requests. Create sprite images that has images and use of SVG for vector assets.
4) Limit blocking requests Browser is waiting for requests before initially rendering (blocking requests). JavaScript/CSS assets look to be the main offenders. Make use of “defer” or “async”. Use of media queries in CSS. When loading a page, during HTML parse, if the browser comes across an external script, like this …
<script src="third-party-script.js"></script>… the browser fetches the script asynchronously and then pauses rendering so it can be executed. This is bad because it slows the critical rendering path, which will result in a worse first contentful paint metric.
The solution is to use the defer attribute, like below:
<script src="third-party-script.js" defer></script>This instructs the browser to download the script as soon as it’s found, but it defers execution until after the HTML parsing is complete. This sidesteps the problem of delaying the critical rendering path and is the recommended way to load 3rd party scripts that manipulate the DOM.
5) Increase the speed with caching Caching stores a copy of the asset that a user has requested and later accesses the cached copy instead of the original copy. There are different types of caching that help to improve delivery speed: Browser cache. Files are stored in the browser local cache so when one wants to access them, there is no need to download them from a server. Cache server. Cache servers are located in different geographic regions so that the user’s requests don’t have to travel far. Memory cache. Memory cache helps to speed up the data delivery process within an application by storing certain parts of data in SRAM. Disc cache. Like a memory cache, disc cache stores data for it to be accessed faster within an application though it makes use of conventional RAM.
6) Use a content delivery network (CDN) The proximity of the mobile carrier's Internet gateway to web servers can impact response times. Using a CDN brings content to servers that are closer to the user, reducing latency and improving performance.
7) Remove unused CSS and JS While loading or running a page, the coverage table in Google Chrome shows how much code was loaded and how much of it was actually used. The size of the pages can be reduced by only shipping the needed code. The process is the following: first, you load a page on Google Chrome, then use a coverage tool (in Dev Tools press Ctrl+Shift+P, type “Coverage”, press Drawer: Coverage). As soon as the page is reloaded, you can see how much unused code is there so you can find those modules and lazy load with import (). Then go to the coverage profile once again and confirm that it carries less code on initial load.
8) Lazy loading Usually, when you load a web page, the browser requests all of its images regardless of whether they’re in the viewport or further down the page and out of sight. Lazy loading allows us to only load the images which are visible and asynchronously load the rest on-demand as the user scrolls. This reduces the number of requests on load and can speed up the process considerably. Trigger events/animation only once you scroll & lazy load the images.
9) Reduce the number of DOM elements complex page means more bytes to download, and it also means slower DOM access in JavaScript. Httparchive.org reports an average of 1,300 DOM elements per page. Reduce the number of DOM elements on the page to improve performance.
10) Avoid empty SRC or HREF You may expect a browser to do nothing when it encounters an empty image SRC tag. However, this isn't the case in most browsers. Safari will make a request to the actual page itself. This behavior could corrupt user data, waste server computing cycles generating a page that will never be viewed, and in the worst case, cripple your servers by sending a large amount of unexpected traffic.
Hopefully, you now know a little more about why optimizing front-end web performance is important and how to accomplish it. Now you can make this a part of your standard workflow and see the considerable benefits for yourself. As you can probably there are a lot of options to choose from, each with its unique feature and it’s up to you to test them and figure out which one works best for you. And like Yoda once said to Luke:

Lastly, there are also a whole list of other things you can do to improve performance that are specific to the framework you’re using (Ex: React, Angular, VUE). The list mentioned in the article is not an all-inclusive list.
28
