21
Getting Started with Litmus 2.0 in Google Kubernetes Engine
This is a quick tutorial on how to get started with Litmus 2.0 in Google Kubernetes Engine. We’ll first set up our basic GKE cluster throughout this blog, then install Litmus 2.0 in the cluster, and finally, execute a simple chaos workflow using Litmus.
But before we kick off the demonstration, let’s have a brief introduction to Litmus. Litmus is a toolset to perform cloud-native Chaos Engineering. It provides tools to orchestrate chaos on Kubernetes to help developers and SREs find weaknesses in their application deployments. Litmus can be used to run chaos experiments initially in the staging environment and eventually in production to find bugs, vulnerabilities. Fixing the weaknesses leads to increased resilience of the system. Litmus adopts a “Kubernetes-native” approach to define chaos intent in a declarative manner via custom resources, although Litmus is not limited to only Kubernetes targets while injecting chaos and is able to target a plethora of non-Kubernetes targets as well, such as bare-metal infrastructure, public cloud infrastructure, hybrid cloud infrastructure, containerized services, etc. to fulfill the chaos engineering needs of an entire business, and not just a specific application microservice.
- A GCP project with sufficient permission for accessing GKE
To set up the GKE cluster, we first need to enable the Kubernetes Engine API in our GCP project. To do that, we can access the APIs & Services Dashboard from the GCP console and search for the Kubernetes Engine API.
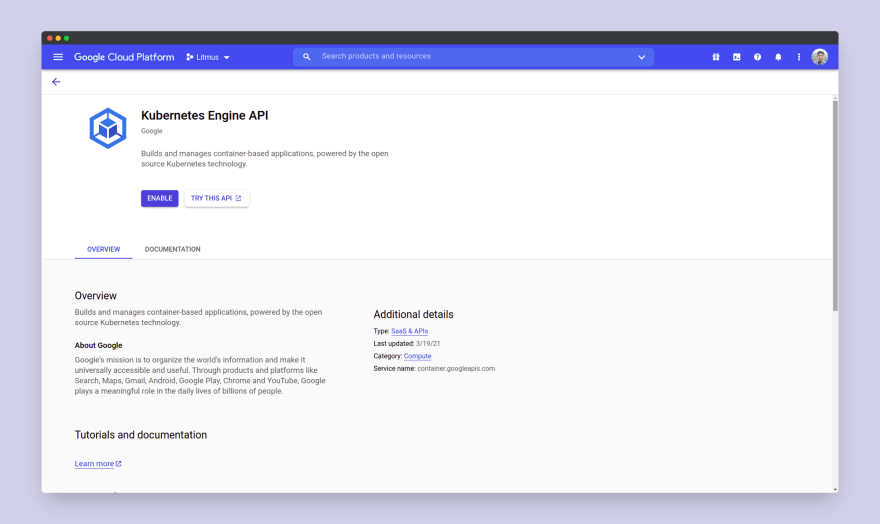
We can then enable the Kubernetes Engine API. Now we are all set to launch our GKE cluster. To do that, we will first go to the Kubernetes Engine dashboard in the GCP console and then choose to Create the cluster.
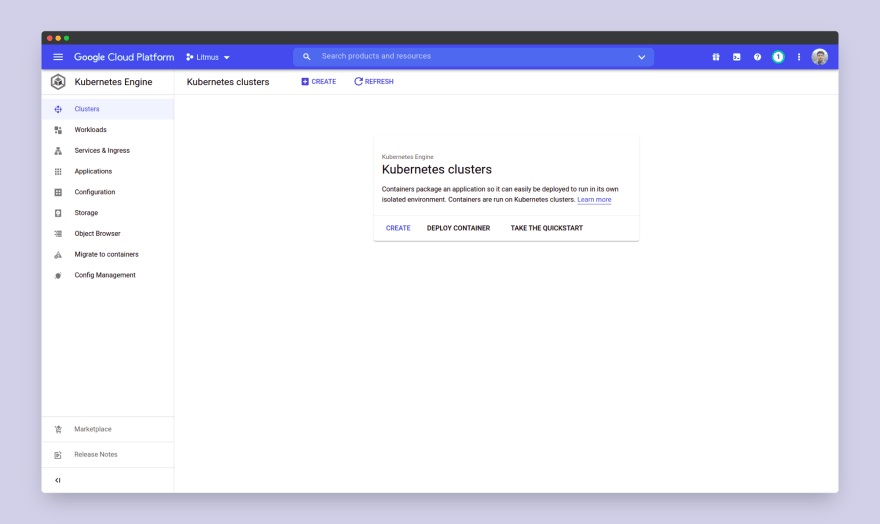
Go for a standard cluster and choose to Configure it.
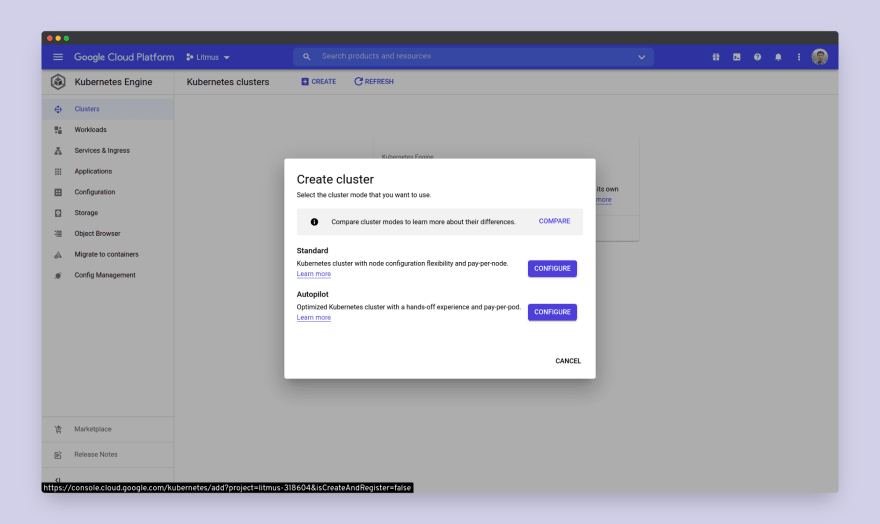
Here you’d get all the options to configure your Kubernetes cluster. You can either choose to configure your own cluster as per your preference or you can simply go for My First Cluster option under the Cluster set-up Guide, which will set up a basic three-node cluster for you.
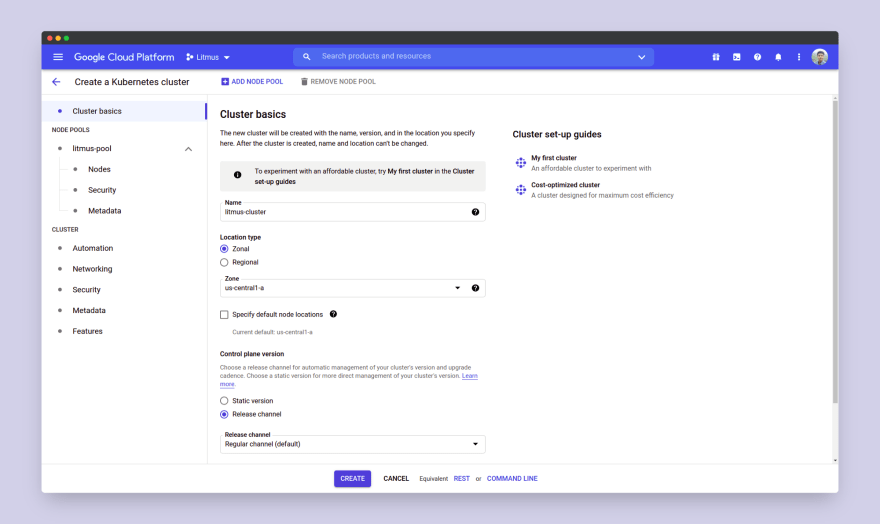
It will take a while for your cluster resources to set up and undergo a health check, after which it would finally be ready.

We can now connect to our cluster and proceed to install litmus. To do that, we need to choose our cluster and then choose the Connect option.
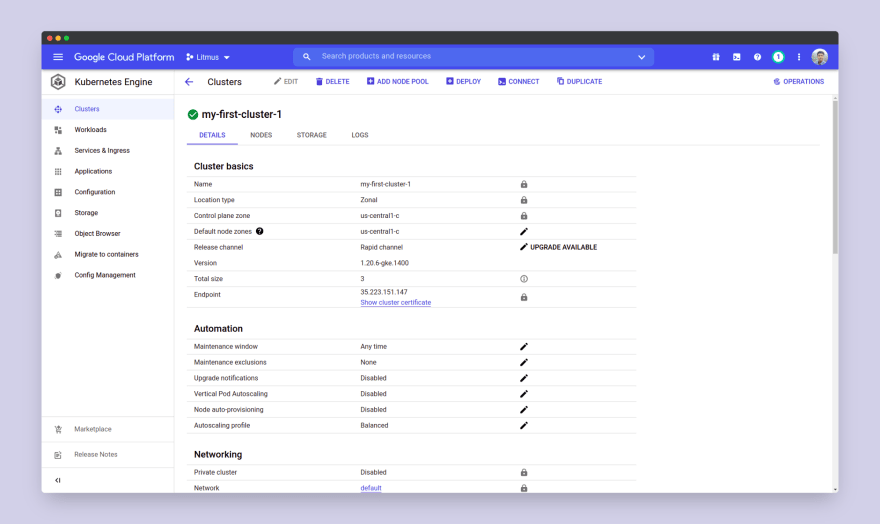
Next, choose the Run In Cloud Shell option.
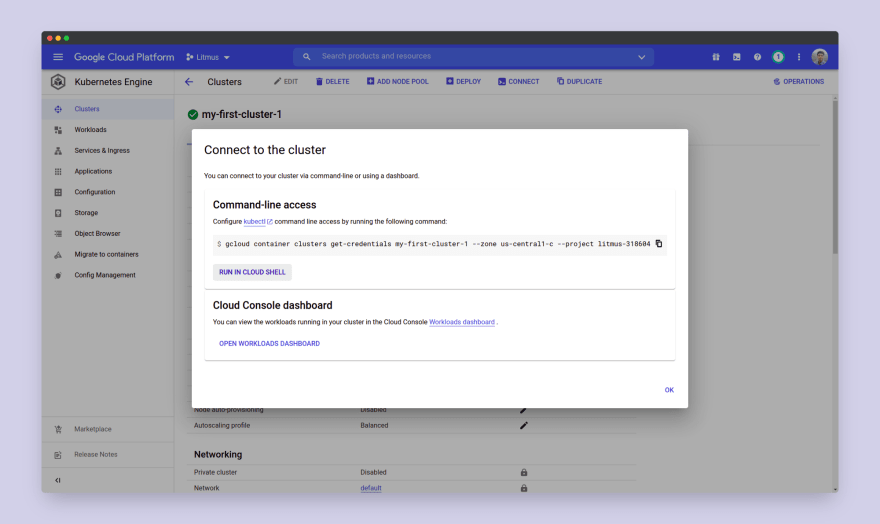
This will open up a cloud shell terminal in your console. A cloud SDK command would be already there in your terminal which you need to execute. This command will configure the Kubectl to configure itself for the cluster we just created. If prompted, choose accept.
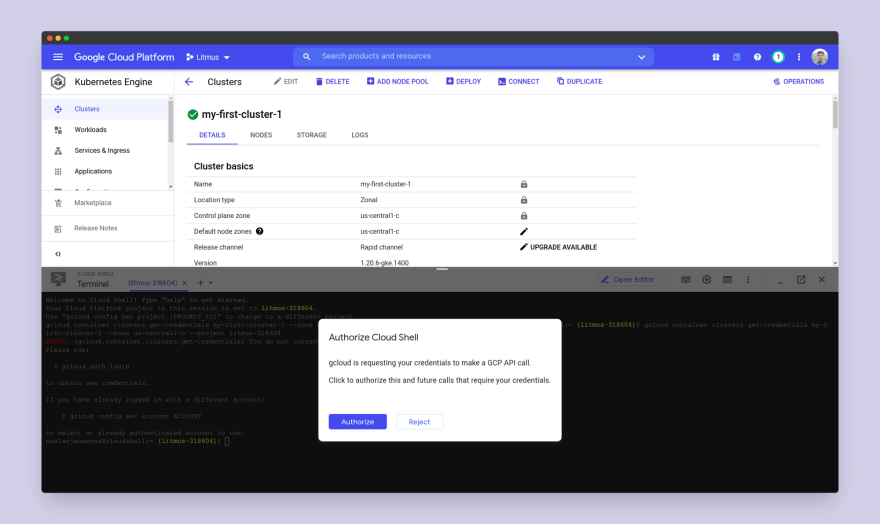
Now we are all set to install Litmus.
We’d follow the instructions given in the Litmus 2.0 documentation to install Litmus. Here we will be installing Litmus in namespace mode using Helm. To do that, the very first step is to add the litmus helm repository using the following command:
helm repo add litmuschaos https://litmuschaos.github.io/litmus-helm/This will add litmuschaos repository to the list of Helm chart repositories. We can verify the repository using the command:
helm repo listYou should see litmuschaos repository listed here. Next, we will create the litmus namespace as all the litmus infra components will be placed in this namespace. We will do this using the command:
kubectl create ns litmusOnce this is done, we can proceed to install the Litmus control plane using the following command:
helm install chaos litmuschaos/litmus-2-0-0-beta --namespace=litmus --devel --set portalScope=namespaceYou should get a similar message:
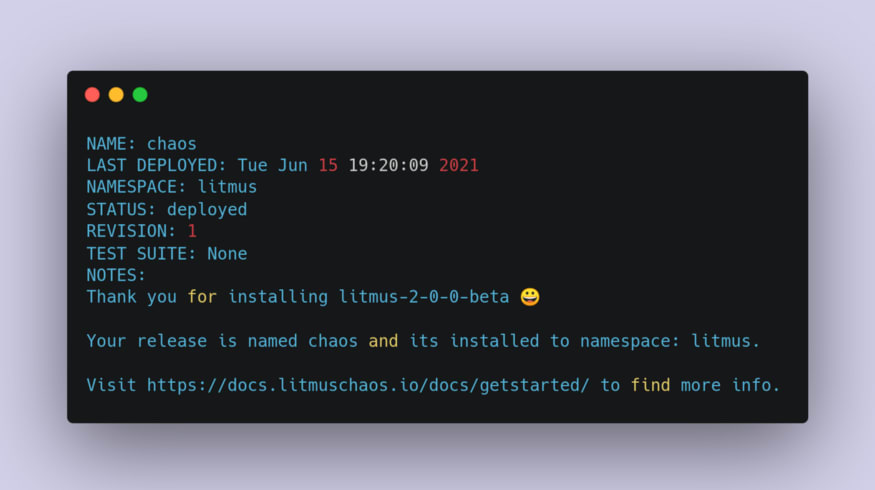
Next, we can proceed to install the Litmus CRDs. Cluster-Admin or an equivalent user with the right permissions are required to install them CRDs. We’d use the following command to apply the CRDs:
kubectl apply -f https://raw.githubusercontent.com/litmuschaos/litmus/master/litmus-portal/litmus-portal-crds.ymlAnd we’re done with installing Litmus. Just one final step before we can access the Litmus portal. If we use the command kubectl get svc -n litmus, we’ll be able to list down all the services running in the litmus namespace. Here you should be able to see the litmusportal-frontend-service and the litmusportal-server-service, both of which should be NodePort services, and their corresponding TCP ports should be something like 9091:xxxxx/TCP where xxxxx is the node port of the respective service. To access the portal, we need to expose both the node ports of the frontend service and the server service by applying a firewall rule. For the litmusportal-server-service we can expose only the first NodePort as there are two of them. We can do that using the following two commands:
gcloud compute firewall-rules create frontend-service-rule --allow tcp:<NODE_PORT>

gcloud compute firewall-rules create server-service-rule --allow tcp:<NODE_PORT>
Replace the <NODE_PORT> in the first command with your frontend service’s node port and similarly replace the <NODE_PORT> in the first command with your server service’s node port. Once done, we’re all set to access the Litmus portal. To do that, use the command kubectl get nodes -o wide to list all the pods in your cluster. You should see something like this:

For any of the nodes, copy its external IP and paste it into your browser URL section, followed by a :xxxxx where xxxxx corresponds to your node port. You should then be directed to the Litmus home screen.
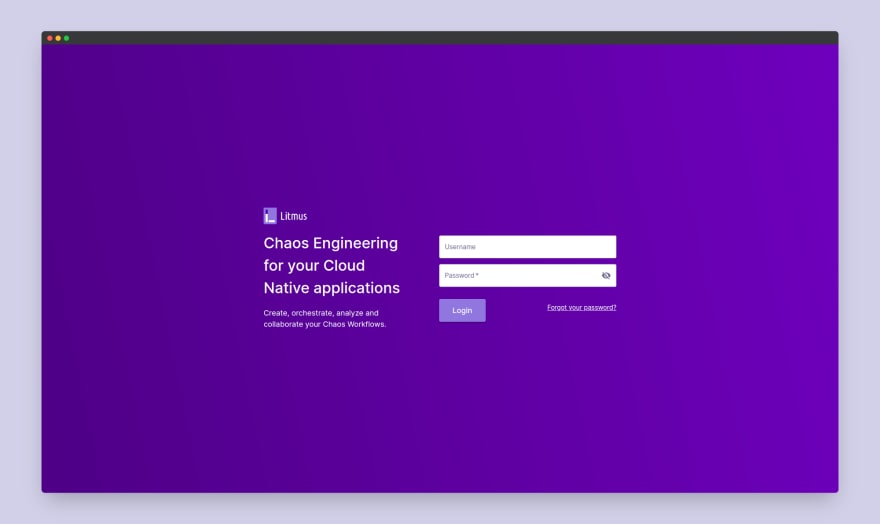
Log in using the username admin and password litmus. Then you’d be asked to set up a password, which you’d use for any subsequent login. Once done, you’d be able to access the Litmus portal dashboard.
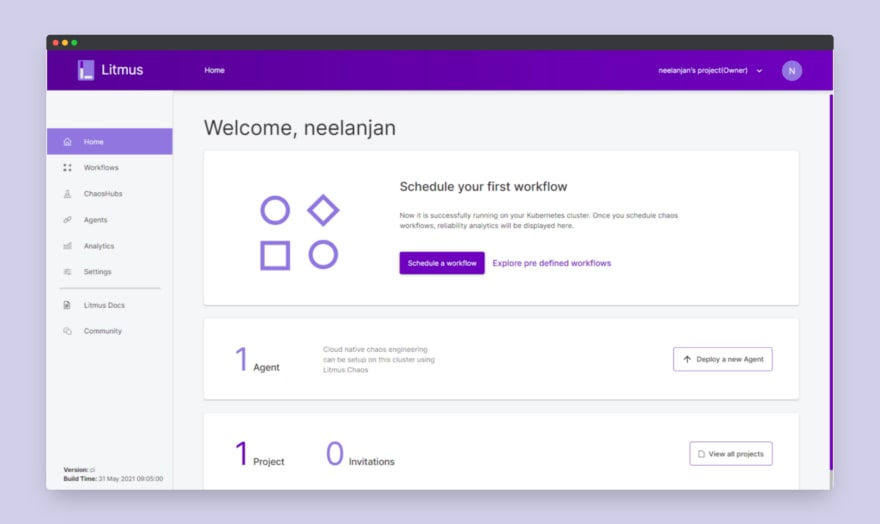
For this demo, we’d see how do chaos workflows execute in Litmus with the help of a predefined chaos workflow template called podtato-head. It is a simple application deployed as a part of the Litmus installation in which we will try to inject pod-delete chaos.
Choose Schedule a Workflow. In the workflows dashboard, choose the self agent and then choose Next. Choose Create a Workflow from Pre-defined Templates and choose podtato-head.

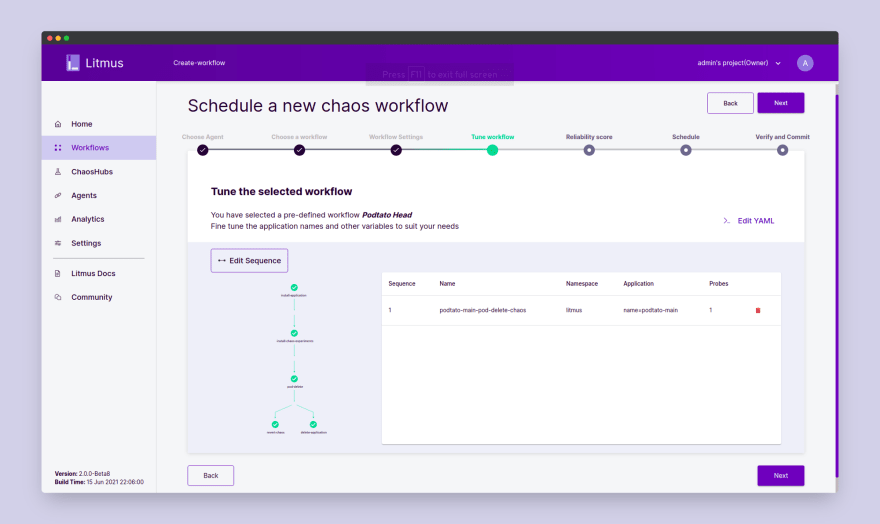
Choose Next. Here we can define the experiment name, description, and namespace. Leave the default values and choose Next. Here we can tune the workflow by editing the experiment manifest and adding/removing or arranging the experiments in the workflow. The podtato-head template comes with its own defined workflow so simply choose Next.
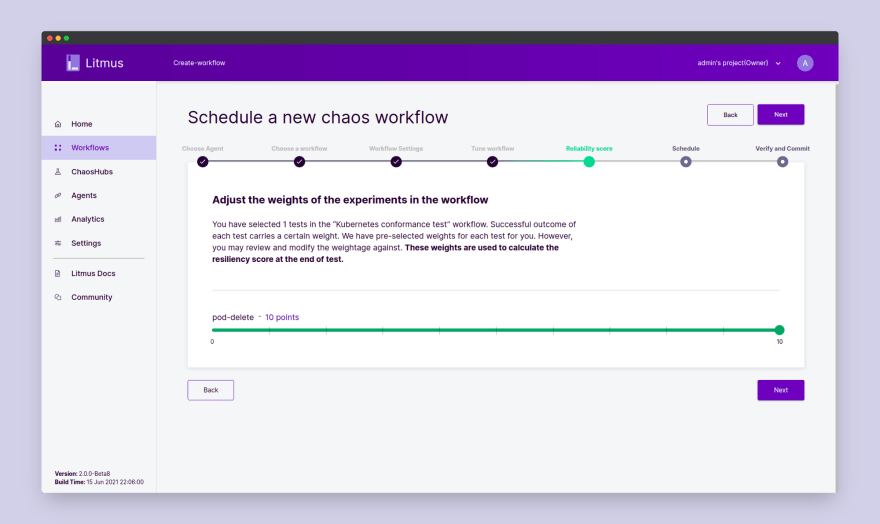
Now we can set a reliability score per chaos experiment in our workflow. Since this workflow has only pod-delete chaos experiment, we can set a score for that in between 1–10. Then choose Next.
Here we can schedule our workflows to be executed in a determined frequency or we can simply schedule it to execute right away. Choose Schedule now. Choose Next. Here we can review the workflow details and make changes if required before finally executing the workflow. Choose Finish. You have successfully started the Chaos Workflow.
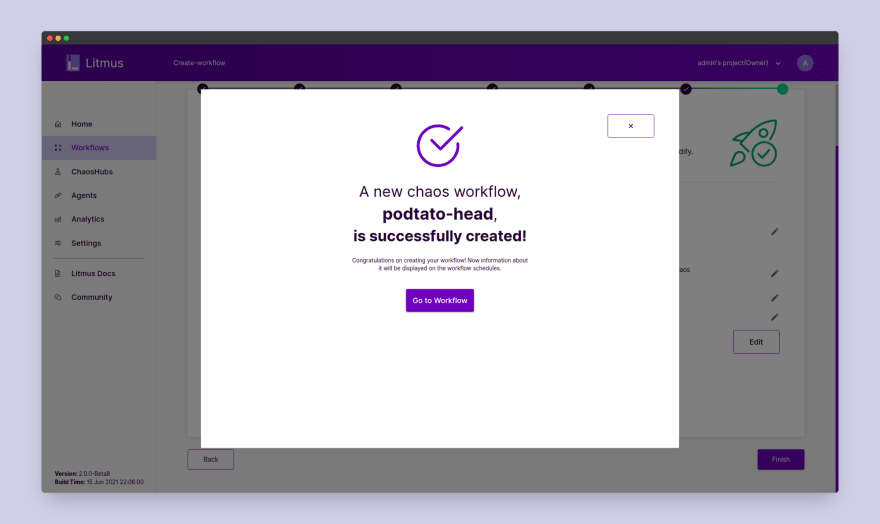
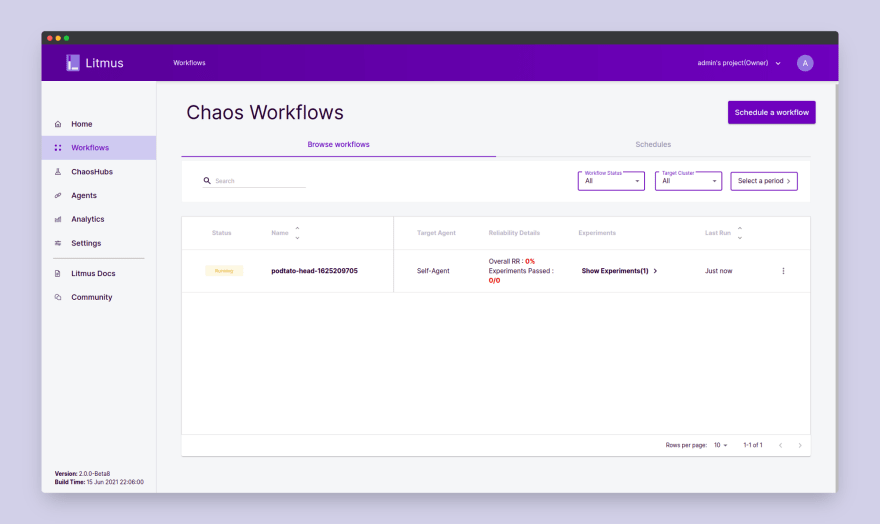
Choose Go to Workflow and you’d see the running workflow:
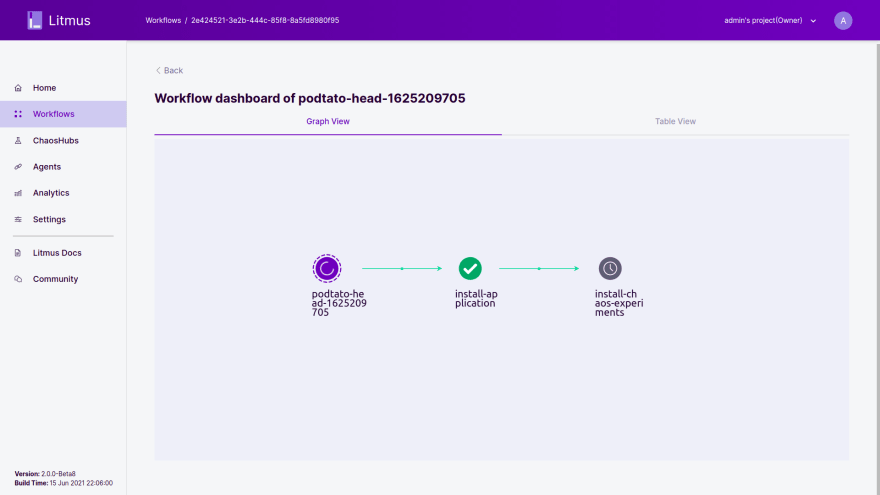
Select the workflow and you’d be able to see the workflow execute in its various stages in the graphical chart:
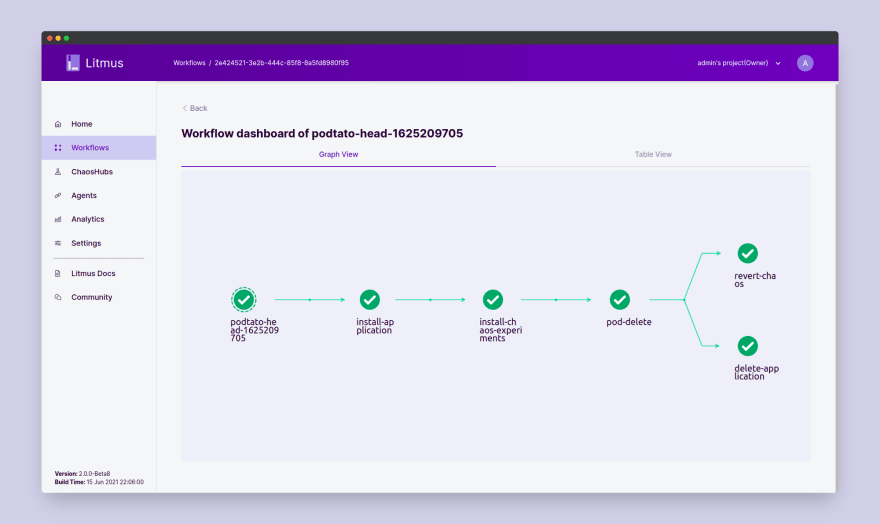
Wait for the workflow execution to complete, once completed the graph would appear as follows:
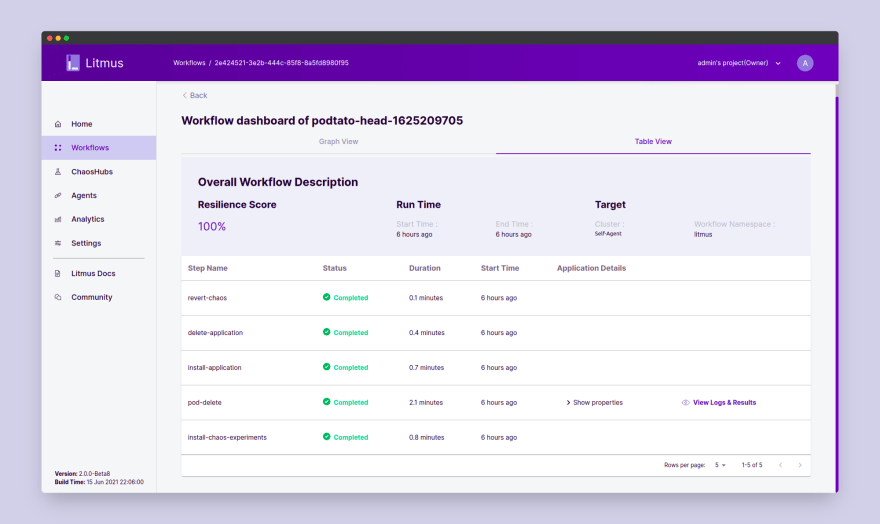
We can analyze the Table View tab for every step as follows:
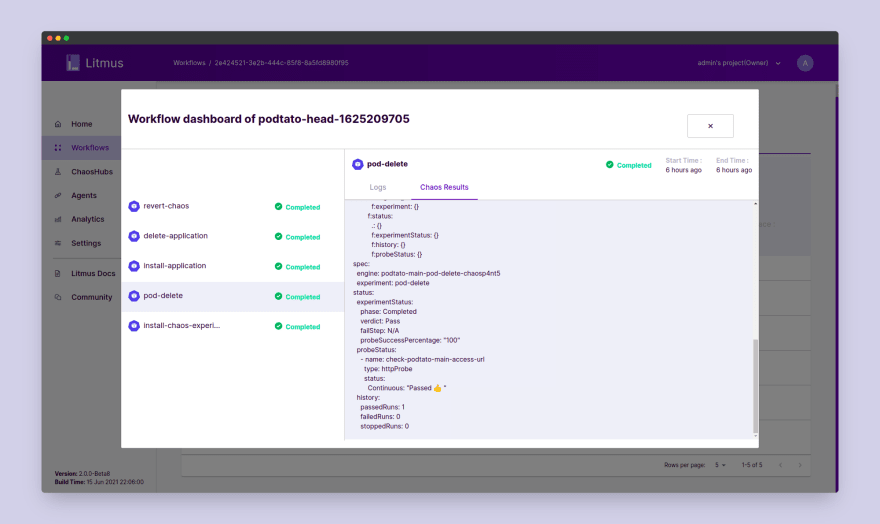
Choose View Logs & Results to access the chaos result of the pod-delete experiment:
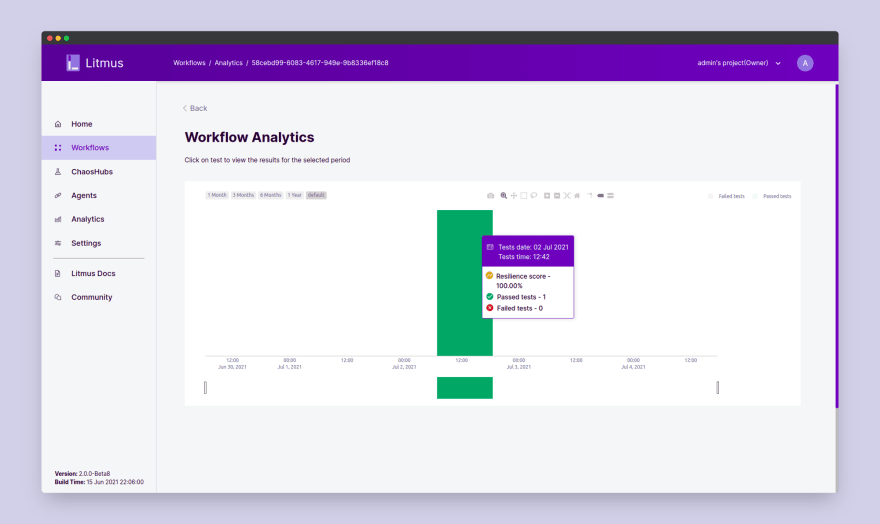
You can also observe the analytics of the workflow from the workflow dashboard page which shows a graphical analysis of the workflow run:
In conclusion of this blog, we saw how to set up a Google Kubernetes Engine cluster, how to install Litmus 2.0, and finally how to execute a chaos workflow using the Litmus portal. Though this is only the tip of the iceberg, I really hope you learned something new today, which will be helpful for your further journey in chaos engineering.
Come join me at the Litmus community to contribute your bit in developing chaos engineering for everyone. To join the Litmus community:
Step 1: Join the Kubernetes slack using the following link: https://slack.k8s.io/
Step 2: Join the #litmus channel on the Kubernetes slack or use this link after joining the Kubernetes slack: https://slack.litmuschaos.io/
Show your ❤️ with a ⭐ on our Github. To learn more about Litmus, check out the Litmus documentation. Thank you! 🙏
21
