
52
Code Execution Monitoring for Symfony applications using Inspector
Hi, I'm Valerio software engineer from Italy and CTO at Inspector.
As product owner I learned on my skin how an application issue can be so hard to identify and fix, creating negative impacts on the users experience, or block new potential customers in their on-boarding path.
Users don't spend their time reporting bugs, they just stop using our application if it doesn't work as expected, looking for another one that fits their needs better.
The idea behind Inspector is to create a monitoring environment specifically designed for software developers avoiding any server or infrastructure configuration that many developers hate to deal with. In fact, thanks to Inspector, you will never have the need to install things on the server or make complex configuration at the infrastructure level.
It works with a lightweight software library that you can install in your application like any other dependencies. In case of Symfony you have our official Symfony Budle at your disposal. Developers are not always comfortable installing and configuring software at the server level, because these installations are out of their software development lifecycle, or are even managed by external teams.
Forcing teams with different goals (Developers, IT infrastructure, Cyber Security, etc.) to work on the same tools can cause confusion or compromise the ability of developers to quickly identify and resolve problems within applications.
Inspector allows developers to have a code driven monitoring environment completely under their control to be the first to know if the application is in trouble "before" users stumble onto the problem.
This can drastically reduce the negative impacts on the user's experience, giving you the right foundation to run a successful users acquisition process and to continually increase engagement in your product with less interruptions as possible.
Inspector is a Symfony bundle to add real-time code execution monitoring to your application, allowing you to work on continuous code changes while catching bugs and bottlenecks in real-time before users do.
It takes less than one minute to get started. Let me show you how it works.
Run the composer command below in your terminal to get the latest version:
composer require inspector-apm/inspector-symfonyGet a fresh Ingestion key by signing up for Inspector and creating a new project, it takes just a few seconds.
You'll see installation instructions directly in the app screen:

Create the inspector.yaml configuration file in your config/packages directory, and put the ingestion_key field inside:
inspector:
ingestion_key: [your-ingestion-key]Execute our test command to check if your app send data to inspector correctly:
php bin/console inspector:testGo to https://app.inspector.dev/home to explore your demo data.
By default Inspector traces:
- Database interactions
- Console commands
- Twig view redering
- Controllers operations
- Unhandled Exceptions
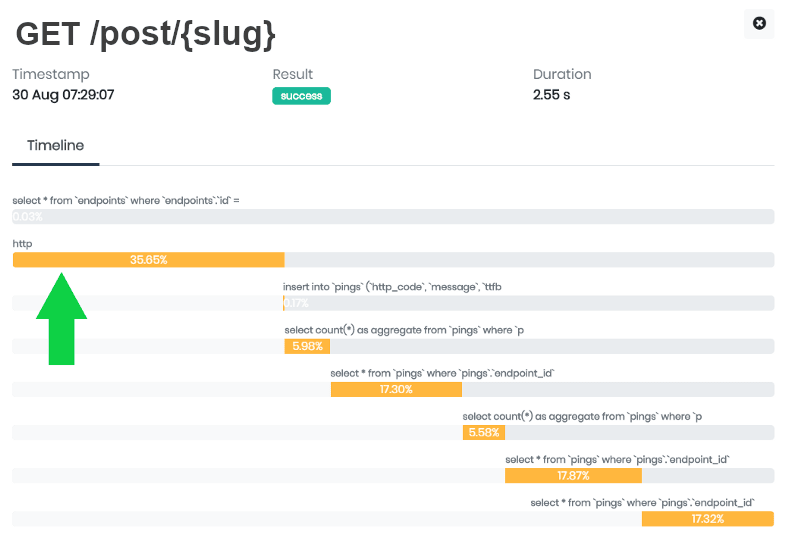
Now when your application receive a request Inspector automatically detect the most important events executed to fullfill the request and it create a visual representation of what happens inside your code during its normal operation.
Transaction streams in your dashboard in real time and for each transaction you can monitor what your application is doing:


Inspector monitors database queries, http requests, console commands by default, but there might be many critical statements in your code that need to be monitored in terms of performance and errors like:
- Http calls to external services
- Function that deals with files (pdf, excel, images)
- Data Import/Export processes
Just as an example.
Thanks to Inspector you can add custom segments in your timeline in addition to those detected by default, to monitor the impact a custom code block has on the application performance.
Let me show you a real life example.
Suppose you have an HTTP route that executes some database oprations and also performs an http call to an external service.
Database queries are automatically detected by Inspector, but it could be interesting to see also the external http request in the timeline to monitor its execution overtime and activate alerting if somethings goes wrong.
class BlogController extends AbstractController
{
    /**
     * @Route("/posts/{slug}", methods="GET", name="blog_post")
     */
    public function postShow(Post $post): Response
    {
        $tags = this->externalService->get('tags');

        return $this->render('blog/post_show.html.twig', compact('post', 'tags'));
    }
}
You can wrap the external service call with a segment to add it in the transaction's timeline. Type hint the Inspector service into the controller method to access the Inspector instance:
use Inspector\Inspector;

class BlogController extends AbstractController
{
    /**
     * @Route("/posts/{slug}", methods="GET", name="blog_post")
     */
    public function postShow(Post $post, Inspector $inspector): Response
    {
        $tags = $inspector->addSegment(function () {
            return this->externalService->get('tags'); // return value will be transparently returned back.
        }, 'http');

        return $this->render('blog/post_show.html.twig', compact('post', 'tags'));
    }
}
By default, every unhandled exception will be reported automatically to be sure you are alerted for unpredictable errors in real time.
I wish that every change I make to my code could be perfect. But the reality is, this is not always the case. Some errors appear immediately after an update, while others pop up unpredictably. It's a fact of life for developers. Many errors often depends by connection issues between our application and other services.
However, Inspector makes the job easier. It automates the detection of unknown issues so I no longer need to manually check the status of my apps continuously or wait reports directly from users. If something goes wrong I'll receive a notification in real time, and after each release I can stay informed about the impact of the last code changes.
If your code fires an exception but you don't want to block the execution, you can report the error to inspector manually for personal monitoring:
try {

    // Your dangerous external call here...

} catch (GuzzleException $exception) {
    $inspector->reportException($exception)
}
When a customer reports to you that something isn't working, it forces you to drop whatever you are doing and start trying to reproduce the scenario, then recapture and reanalyze the logs in your own toolset.
Getting a true picture of what's happening in your code can requires hours or, based on my experience, even days. Inspector can make a huge difference in terms of efficiency, productivity and customers happiness.
New to Inspector? Create your account.
If you want learn more about how to scale up your application, join in Scalable Applications the international community of professional developers to share strategies and experiences building scalable systems.
Join us now: https://www.facebook.com/groups/scalableapplications
52