
31
Seaborn Scatterplot
It's recommended to use Google Colab or Jupyter Notebook or Jupyter Lab in Anaconda.
import matplotlib.pyplot as plt
import seaborn as sns
import pandas as pdWe will try to load data from various types like
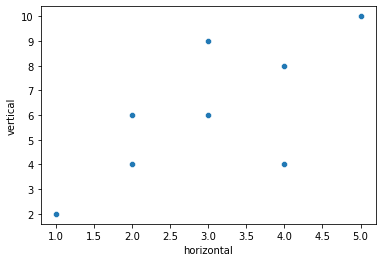
list, tuple, dict or dataframe.horizontal = [1, 2, 3, 4, 5, 2, 4, 3]
vertical = [2, 4, 6, 8, 10, 6, 4, 9]
sns.scatterplot(x=horizontal, y=vertical)horizontal = (1, 2, 3, 4, 5, 2, 4, 3)
vertical = (2, 4, 6, 8, 10, 6, 4, 9)
sns.scatterplot(x=horizontal, y=vertical)dict_data = {
'horizontal': (1, 2, 3, 4, 5, 2, 4, 3),
'vertical': (2, 4, 6, 8, 10, 6, 4, 9),
}
sns.scatterplot(x='horizontal', y='vertical', data=dict_data)dict_data = {
'horizontal': [1, 2, 3, 4, 5, 2, 4, 3],
'vertical': [2, 4, 6, 8, 10, 6, 4, 9],
}
df = pd.DataFrame(dict_data)
sns.scatterplot(x='horizontal', y='vertical', data=df)Any of the above code will display the same plot like this:
Using Web Color Name:
sns.scatterplot(x='horizontal', y='vertical', data=df, c=['red'])or Using Hex
sns.scatterplot(x='horizontal', y='vertical', data=df, c=['#c21b95'])
sns.scatterplot(
    x='horizontal',
    y='vertical',
    data=df,
    c=['#c21b95'],
    alpha=0.4
)
We can classify each dot depends on another feature. We add new feature named
class that has category name for each dots.df = pd.DataFrame({
'horizontal': [1, 2, 3, 4, 5, 2, 4, 3],
'vertical': [2, 4, 6, 8, 10, 6, 4, 9],
'class': ['category 2', 'category 1', 'category 3', 'category 2', 'category 3', 'category 1', 'category 3', 'category 2']
})
sns.scatterplot(x='horizontal', y='vertical', data=df, hue='class', hue_order=['category 3', 'category 1', 'category 2'])
31