
44
Profiling Django App

The Django application can consume more than expected memory or time. The blog post will focus on profiling performance. Some of the reasons why Django App can be slow
Here is a sample book counter application that contains three models - Book, Author, and Shelf. A shelf contains a list of books. A book has many authors.
# book/models.py

from django.contrib.auth.models import User
from django.db import models


class Author(models.Model):
    first_name = models.CharField(max_length=255, blank=False, null=False)
    middle_name = models.CharField(max_length=255, blank=True, null=True,
                                   default='')
    last_name = models.CharField(max_length=255, blank=True, null=True,
                                 default='')
    profile_photo = models.URLField(default='', blank=True, null=True)


class Book(models.Model):
    name = models.CharField(max_length=255, blank=False, null=False)
    cover_photo = models.URLField(default='', blank=True, null=True)
    language = models.CharField(max_length=255, blank=True, null=False)


#shelf/models.py
from django.db import models

# Create your models here.
from book.models import Book


class Shelf(models.Model):
    name = models.CharField(max_length=255, unique=True,
                            db_index=True, null=False, blank=False)
books = models.ManyToManyField(Book, related_name="shelves")#shelf/views.py
class ShelfViewSet(viewsets.ViewSet):
http_method_names = ["get"]
queryset = Shelf.objects.all()
def list(self, request):
name = request.GET.get('name')
qs = self.queryset
if name:
qs = qs.filter(name=name)
data = ShelfSerializer(qs, many=True).data
return Response(data)#book/serializers.py
from rest_framework import serializers
from book.models import Author, Book
class AuthorSerializer(serializers.ModelSerializer):
class Meta:
model = Author
fields = ("first_name", "middle_name", "last_name", "profile_photo")
class BookSerializer(serializers.ModelSerializer):
authors = AuthorSerializer(many=True)
class Meta:
model = Book
fields = ("name", "cover_photo", "language", "authors")
#shelf/serializers.py
from rest_framework import serializers
from shelf.models import Shelf
from book.serializers import BookSerializer
import time
classic_books = ['War And Peace', 'Lolita', 'The Stranger']
class ShelfSerializer(serializers.ModelSerializer):
books = BookSerializer(many=True)
class Meta:
model = Shelf
fields = ("books", "name")
def to_representation(self, obj):
book = super().to_representation(obj)
if book['name'] in classic_books:
book['is_classic'] = True
else:
book['is_classic'] = False
time.sleep(1)
return bookThe application has an endpoint
/shelf/ that returns all the shelves along with books and authors using DRF model serializer.
Since the profiler records the call stack, every fixed interval(can be configured to lower value too, say 1ns) has a low overhead.
Profiling time = program execution time + profiler recording timeIf the program takes
0.33s to run, pyinstrument profiling takes 0.43s (30% extra) , cProfile takes 0.61s (84% extra). Pyinstrument is a Python profiler that offers a Django middleware to record the profiling.
MIDDLEWARE list variable. MIDDLEWARE+=[ 'pyinstrument.middleware.ProfilerMiddleware'].
PYINSTRUMENT_PROFILE_DIR contains a directory that stores the profile data.
By default, pyinstrument produces HTML profile information.
The right corner contains the metadata.
- SAMPLES - number of samples collected during the execution.
- DURATION - Total duration of the profiling.
The tree structure captures the flow of the code along with the time spent.
Each line is a frame that contains the duration, function/method name, file path, and line number.
data = ShelfSerializer(qs, many=True).data in the views, took 2.09 seconds.
The profiler auto hides any standard library and third-party calls to provide a brief overview of the program call graph.
From the profile, sleep function inside the serializer takes most of the time.
settings variables.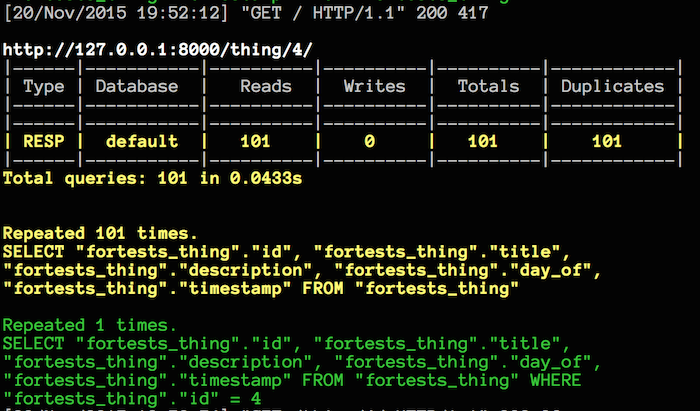
Add querycount.middleware.QueryCountMiddleware to the MIDDLEWARE settings variable.
The middleware supports printing duplicate queries. Following are some extra settings options.
QUERYCOUNT = {
      'THRESHOLDS': {
          'MEDIUM': 50,
          'HIGH': 200,
          'MIN_TIME_TO_LOG':0,
          'MIN_QUERY_COUNT_TO_LOG':0
      },
      'IGNORE_REQUEST_PATTERNS': [],
      'IGNORE_SQL_PATTERNS': [],
      'DISPLAY_DUPLICATES': True,
      'RESPONSE_HEADER': 'X-DjangoQueryCount-Count'
}# output in the server console
[17/Oct/2021 11:05:43] "GET /shelf/ HTTP/1.1" 200 1031
http://localhost:8000/shelf/
|------|-----------|----------|----------|----------|------------|
| Type | Database | Reads | Writes | Totals | Duplicates |
|------|-----------|----------|----------|----------|------------|
| RESP | default | 8 | 0 | 8 | 1 |
|------|-----------|----------|----------|----------|------------|
Total queries: 8 in 2.0803s
Repeated 1 times.
SELECT "book_book"."id", "book_book"."name",
"book_book"."cover_photo", "book_book"."language" FROM "book_book"
INNER JOIN "shelf_shelf_books" ON ("book_book"."id" =
"shelf_shelf_books"."book_id") WHERE "shelf_shelf_books"."shelf_id" =
1
Repeated 1 times.
SELECT "shelf_shelf"."id", "shelf_shelf"."name" FROM "shelf_shelf"
# output in the client
$http http://localhost:8000/shelf/ --header
HTTP/1.1 200 OK
Allow: GET
Content-Length: 1031
Content-Type: application/json
Date: Sun, 17 Oct 2021 11:05:43 GMT
Referrer-Policy: same-origin
Server: WSGIServer/0.2 CPython/3.9.7
Vary: Accept, Cookie
X-Content-Type-Options: nosniff
X-DjangoQueryCount-Count: 8
X-Frame-Options: DENY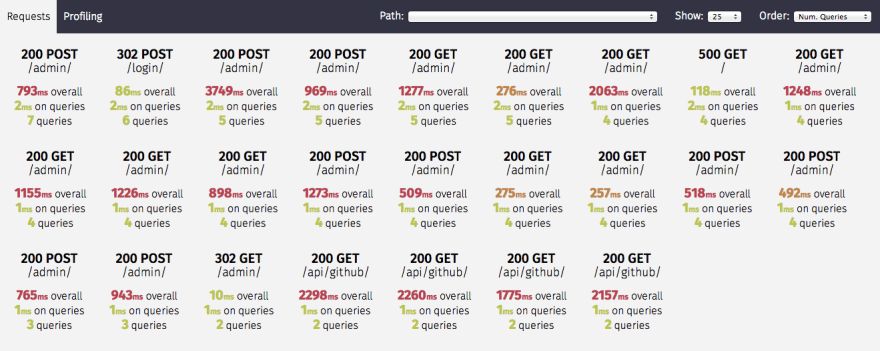
Silk is a live profiling and inspection tool for the Django framework. Silk intercepts and stores HTTP requests and database queries before presenting them in a user interface for further inspection.
pip install git+https://github.com/jazzband/django-silk.git#egg=django-silkThe latest PyPI version doesn't support Django 3.2.
'silk.middleware.SilkyMiddleware' to MIDDLEWARE settings variable.silk to INSTALLED_APPS settings variable.urlpatterns += [url(r'^silk/', include('silk.urls', namespace='silk'))].migrate to create tables. python manage.py migrate.collectstatic to collect static files, python manage.py collectstatic.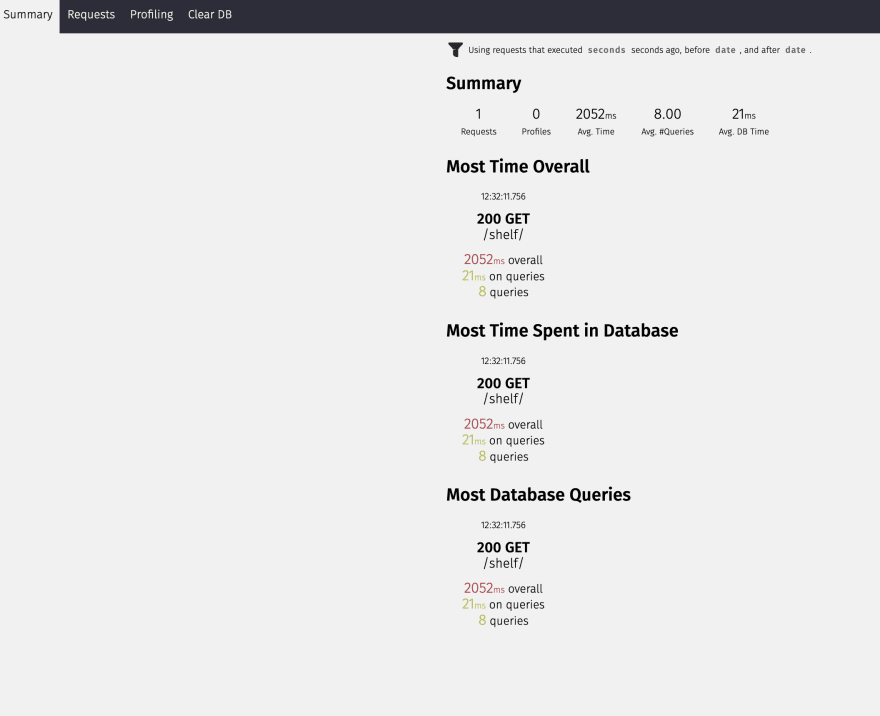
/silk/ endpoint is the dashboard and lists all the recorded requests.Most Time Overall shows, the response status, total response time, total time spent in queries, and total number of queries. 
request headers details, response headers, and details on how to use the client to connect to the endpoint.
query plan and Python traceback to find the source of origin. SILKY_ANALYZE_QUERIES variable controls the feature to analyze the SQL query. 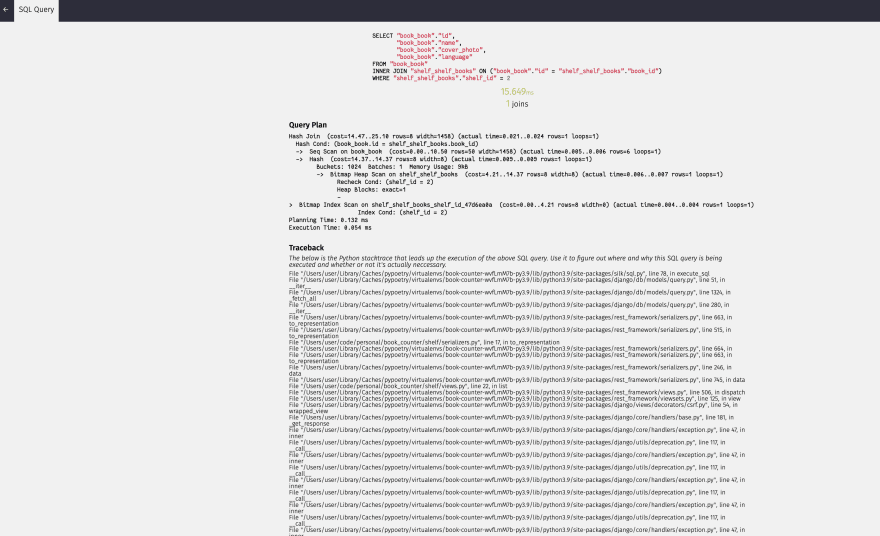
Silk also provides option to generate Python profile code for a view or any Python function using a decorator or a context manager. Below is the modified view.
from silk.profiling.profiler import silk_profile

class ShelfViewSet(viewsets.ViewSet):
    http_method_names = ["get"]
    queryset = Shelf.objects.all()


    @silk_profile(name='Shelf list')
    def list(self, request):
        name = request.GET.get('name')
        qs = self.queryset

        if name:
            qs = qs.filter(name=name)

        data = ShelfSerializer(qs, many=True).data
        return Response(data)

  SILKY_DYNAMIC_PROFILING = [{

      'module': 'shelf.views',

      'function': 'ShelfViewSet.list'

  }]
SILKY_META controls it. When set to True, the dashboard displays the time taken by silk in red color in the display card.Performance is a feature that lets the user of the application perform certain types of operations quicker. The profiling tools help developers to measure the application's performance and make decisions accordingly.
There are other Django/Python profilers, but these three profilers help measure and understand the Django application performance. Use these tools to make your Django application faster.
1. 🚀Profiling Django App 🚀- https://t.co/EifIAiW8ba. In this blog post, I discuss three tools. #Django #Python
— kracekumar || கிரேஸ்குமார் (@kracetheking) October 17, 202144