20
How to create a custom cursor in React Part — 2 [Mathematical explanation]
If you’re looking for the source code then it’s available in the video 😉
Please support by watching this video 😢
This article is mainly focused on the mathematical part of the cursor animation (cursor outline). Part 1 of the article was completely related to the code part if you want to see how it is working then you can follow it.
The main part revolves around this function —

The requestAnimationFrame also provides us with a timestamp variable which we can use to see after what time interval our recursive function is being called.
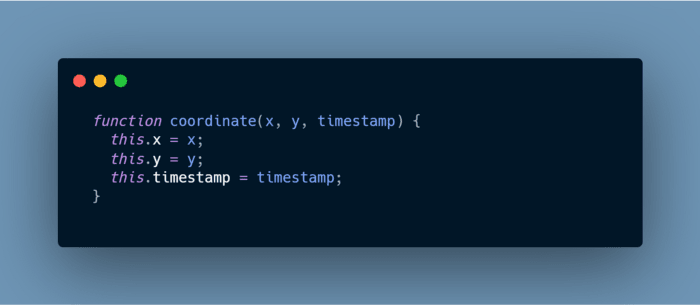
We also need to store the x and y points every time this function is called. So, for that, we can create a function that can store all these 3 properties.

We need to tweak our animateOutline function also in order to get the desired output.

We are pushing the coordinate object inside the coordinates array.
New conditions have been added to stop the requestAnimationFrame function from calling it again. As per the condition, we will call it recursively only till the time cursor outline’s coordinate aren’t equal to the cursor dot’s coordinate.
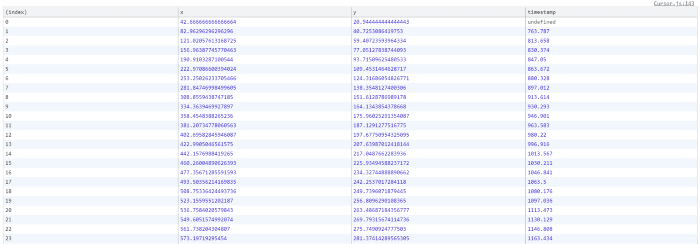
We will console log when the coordinates become equal. We’ll be using console.table function because provides a nice tabular view of the output.


There are few things which we can conclude from this data —
The difference between the timestamps is almost constant, that is, 16–17ms. If you read this article then you’ll know that it’s simulating 60FPS (1000/60). This 1000ms divided by 60 is equal to 16.67ms.
The data points have a huge difference in the initial phase of the animation but the difference reduces as time increases.

We are adding the new value and the previous value. endX is constant so if we subtract the x from it after every iteration the numerator will keep on decreasing. And eventually it becomes somewhat near to 0.


If we plot x points with respect to timestamp then we will get a graph like this

Somewhat looks like a logarithmic graph and ease-out cubic bezier function. Increases quickly in the initial phase and then the increment rate decreases.
And that’s it, this is how we are able to achieve this smooth ease-out type of transition with the help of javascript. 🤩🥳
20
