20
How To Analyze An Angular Project with Fortify
Rogelio Flores Zubillaga | ng-conf | May 2019

Recently, I started a small Angular application that acts as an installer for a distributed API Gateway application. As part of our testing and quality engineering, we always inspect our web applications. However, we hadn’t done much with static code analysis. It was mostly security dynamic analysis over our client and server communication. Fortify is a product that we have used for this since the company that I work for owns it, and recently they added support for Typescript in their static code analysis. So this was a great opportunity to use it on our Angular project.
Fortify is a product of Micro Focus that allows security scans of applications. Many people are familiar with “WebInspect”, which some people use as a synonym for Fortify.
Think of Fortify as big happy family where there are several siblings. Each sibling is a product or program you can run. “Fortify WebInspect” provides dynamic analysis of web applications and services. This is like the first-born son that makes their parents proud. You always want to show others that you run his security scans. Some of your customers might even require that you do this. It helps you prove that your software is secure.
Fortify Static Code Analyzer (SCA) identifies security vulnerabilities in the source code. Think of it as the sibling everyone dislikes. Like the know-it-all boy in the Polar Express. Nobody likes him because it will usually tell you things you don’t like to hear. Such as “your code sucks”, or “your code is insecure”. So you try to avoid him.
Fear no more.

In this article, I will focus only on Fortify SCA. Yes, the annoying kid. Fortify SCA is best used during the software development phase. Thus, the target audience of this article are software engineers. Whether involved in the development, or the testing and quality of web applications.
Most Angular applications use Typescript. And Angular is one of the most used web frameworks nowadays, so let’s explore how to use Fortify with Angular. Our method will apply to any project that uses Typescript and Javascript though.
We’re going to talk about the on-premise client of Fortify SCA. There is Fortify On Demand, which is the SaaS offering (more on that later). If you don’t have Fortify yet, you can get it here. There is the option to get a free trial, which comes with some limitations. I suggest you download Fortify SCA and “Applications”, which means you will get the Source Analyzer (the scanner), the Scan Wizard, the Report Generator, Audit Wizard, and others. We will talk at least about these four. Once you have downloaded the software, you go through these steps to install them:
- Run
installbuilder, found in the compressed file you downloaded. HitNext(after each of the following steps as well). - Accept the license agreement
- Accept default installation directory or provide your own
- Specify where your license file
fortify.licenseis - (Optionally) provide server settings for security content updates. I left the default Update server URL and didn’t need to provide a proxy host/port.
- Answer if you want to migrate from a previous SCA installation (I didn’t have one, so I said no)
- Select if you want to install sample source code projects
At the end of the installation, you will see a screen like this:

When the installation completes, you will see a checkbox that reads “update security content after installation”. If you leave it selected (default), a quick update will run. When it’s done, a few seconds later, a new dialog appears with the updates, which you can dismiss with an OK button. You are now ready to start using it to scan your project.
I know of at least three ways you can run a static code analysis with Fortify. One is to simply run sourceanalyzer from the command line. A second way is using the Scan Wizard to help you create a script that runs the scan. And the third way is to use the Audit Workbench to run your scan, which is probably the easiest one. The last two methods eventually run sourceanalyzer. Unfortunately, if we’re talking about an Angular project — but this applies to any project that contains Typescript files, the only way I found to scan Typescript files was to use the command line.
However, since the command line needs a Build ID, I will teach you how to create a script with the Scan Wizard, which creates one. This will also teach you more about some of the options sourceanalyzer by looking at how the generated script calls it.
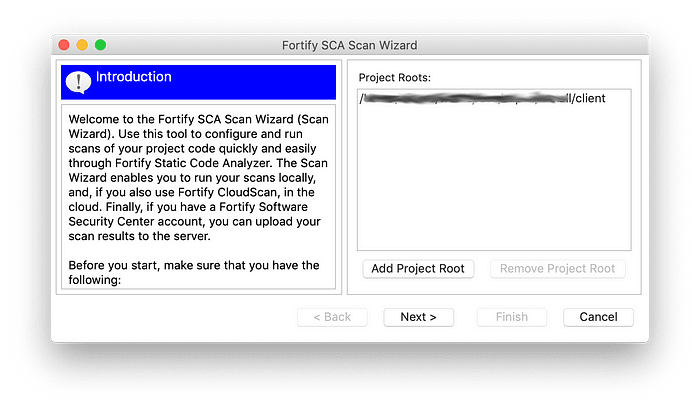
Fortify provides you with the Scan Wizard (ScanWizard executable), which generates a script for your platform, based on some inputs and options. Run it, and you will see a wizard with this screen (I have already selected a Project Root):

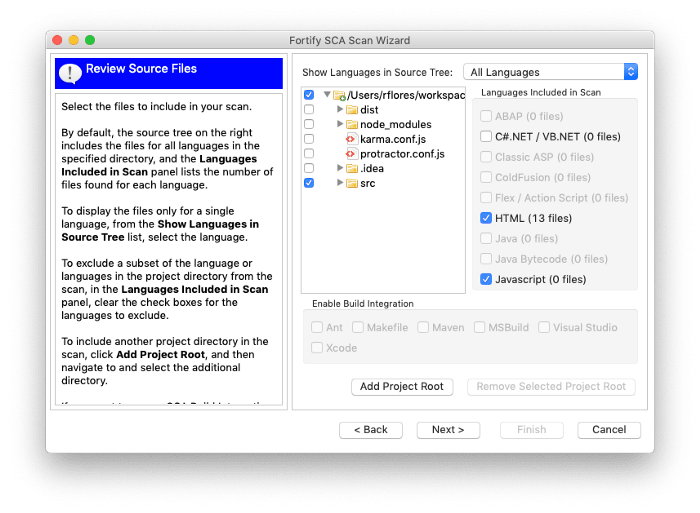
Select the Add Project Root button and specify the path to your application. Then hit Next. The wizard will then scan your project root and find all the source code files that it can potentially scan. It might take a few seconds. You will now see this screen:

By default, it will have all directories selected. You can deselect directories such as node_modules unless you want to scan all your dependencies. By deselecting directories, the wizard will update the file count and automatically detect the languages used in those directories. You can deselect languages as well if you don’t want to scan a particular set of files. Note that Typescript doesn’t appear in the list of languages. Don’t worry, I’ll tell you later how to add Typescript files to the scan.
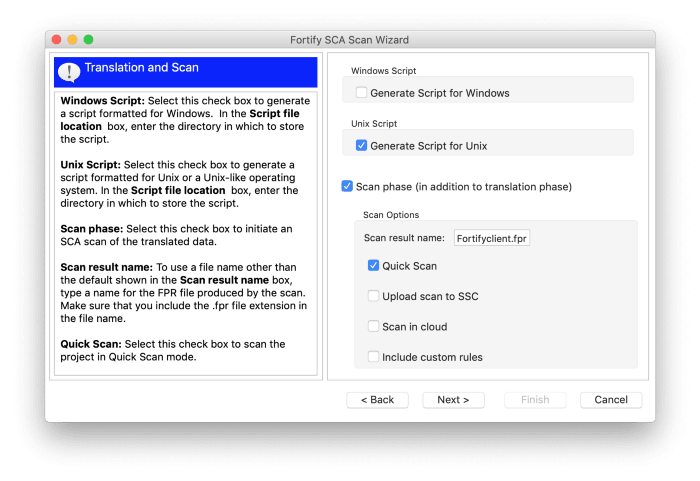
Once you have made your selections, hitting Next will take you to the Translation and Scan screen of the wizard. In this screen you select for which platform you want to generate a script. You can also select whether you want a quick scan. Note that if you select this option, your scan will be faster, but you will be sacrificing accuracy. I recommend that you use this option the first time you run a scan. That way you don’t have to wait as long to make adjustments, if needed. Once you’re satisfied with your settings, you can turn off the “quick scan”.
The other options are to automatically upload the results to Fortify’s SSC (cloud-based product), or include custom rules. I will not discuss these options in this article.

After clicking on the Next button, you end up with the actual script:

Finish the wizard and you will find the output script on your project’s root directory. By default the script didn’t have executable rights after it gets created. To fix that, simply add executable rights like this on a UNIX-like system:
chmod +x FortifySCA.shBefore you can execute your script, you might need to add Fortify’s bin directory to your PATH environment. On Unix-like systems, you do something like this:
export PATH=$PATH:/Applications/Fortify/Fortify_SCA_and_Apps_18.20/binAccording to Fortify’s documentation, to be able scan Typescript, we need to change the default configuration. We need to enable “higher order ” analysis and languages, and specify javascript/typescript. These are the properties I added to my properties file:
com.fortify.sca.hoa.Enable=true
com.fortify.sca.Phase0HigherOrder.Languages=javascript,typescript
com.fortify.sca.EnableDOMModeling=true
The third property above is recommended for DOM-related vulnerabilities in the documentation. You can specify these properties in three ways, in order of the priority they will be used:
- Using the
-Doption on the command-line - Specifying them in the
{Fortify Installed Dir}/Core/config/fortify-sca-quickscan.propertiesfile, but only if you specify the-quickoption to run a “quick” scan. - Specifying them in the
Core/config/fortify-sca.propertiesfile. - There is also a
Core/config/fortify.propertieswhich has more higher-level properties that users seldom need to change. You could also put your properties here.
Note that if you add your properties to any of these files, they will affect every scan on that system.
So, the full command on the CLI to run your scan could look like this:
./FortifySCA.sh -Dcom.fortify.sca.EnableDOMModeling=true -
Dcom.fortify.hoa.Enable=true -
Dcom.fortify.sca.Phase0HigherOrder.Languages=javascript,typescript
However, running this command didn’t include Typescript files in the scan. To include them, I had to explicitly tell the analyzer to scan those files. I also couldn’t use the script just generated to include Typescript files in the scan. I had to use sourceanalyzer. But you could simply reference the same Build ID that your script generated (look for BUILDID= in your script).
Finally, this is how you can run an analysis on your Angular project which will include your Typescript files:
sourceanalyzer -b <build_id> clean
sourceanalyzer -b <build_id> <path_to_code_root>/**/*.ts
sourceanalyzer -Xmx14745M -Xms400M -Xss24M -b <build_id> -quick -scan -f results.fpr
The first command simply cleans any previous artifacts of the scan. If this is your first time running it, you don’t need it. But you don’t want to forget to do that especially if you automate this process on a build system. You might also be able to modify the output script from the Scan Wizard to add these options.
Note that on the third command above I’m specifying a limit on the memory used (the -X** flags, and also providing the -quick flag). This is because I ran this on my laptop, which doesn’t have enough memory to run a full scan. Remove these options once you have your final setup on a machine that has more than 16GB of memory. See the documentation links at the end of this article for system requirements.
You can put these commands in a single script that can be part of your build process. You can include it in a tool like Jenkins. For instance, your scan can run when triggered by a SCM commit and/or be part of your CI pipeline.
To read the output of the scan, open your “Audit Project” with Audit Workbench. The Audit Project is what the documentation calls the output file (which ends in .fpr) of your scan. Audit Workbench is one of the applications that you can download with Fortify. In it, you see all the vulnerabilities categorized by levels; Critical, High, Medium, and Low.
Here is a sample screenshot. It’s from a scan of an Angular project. Note that it detected a privacy violation on a Typescript file. This issue is actually triggered from an HTML template. It categorized it as Critical, but since it’s related to a debug-only print out, we’re not too worried.

You see summaries of each vulnerability along with details and recommendations for remediation.
Scanning your application often during the development cycle will help improve quality. It also gives you trends that you can track. And you track them so that you identify and eliminate the bad ones. Changes during the development phase are cheaper than when the code is complete.
Don’t wait until you’re ready to ship to scan your application.
You can also create reports and automate the process. Instead of opening the Audit Project with Audit Workbench, you can generate a report. There are two generators, ReportGenerator and BIRTReportGenerator. I had used the open source reporting engine BIRT before (and liked it), and it was recommended by the documentation anyway, so that’s the one we’re using.
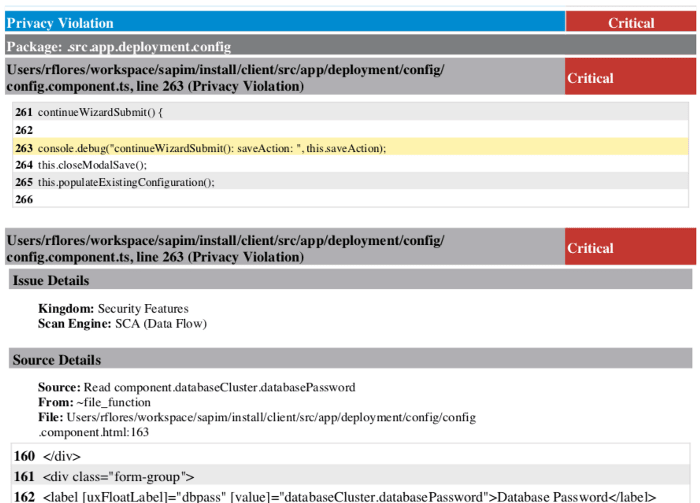
This is the command I ran to create a PDF document with a report based on OWASP Top 10 2017, following by a screenshot:
BIRTReportGenerator -template "OWASP Top 10" -source results.fpr -output myreport.pdf -format PDF -showSuppressed -Version "OWASP Top 10 2017"
Part of the Developer Workbook report. It shows an issue found in a Typescript file. The file is part of an Angular Component
There are several templates to use, depending on what type of report you want. This is the full list included in the installation:
- Developer Workbook
- DISA STIG
- CWE/SANS Top 25
- FISMA Compliance
- OWASP Mobile Top 10
- OWASP Top 10
- PCI DSS Compliance
- DISA CCI 2
I have ran successfully the first two reports from the list, plus the OWASP Top 10 as shown above. To learn the meaning of the options I used, and other ones available when generating BIRT reports, run
BIRTReportGenerator -helpYou will see that there is a --Version option for some of the report templates. These target specific versions of specifications that you might be interested in being compliant.
Fortify also has a SaaS option. It’s called Fortify on Demand (FoD). If you’re using it, upload your source code, and wait for the results.
Note that the free trial version of Fortify on Demand does not support Typescript
There is also a plugin for the most popular IDEs. Along with an account with FoD, you can run scans during development without leaving your IDE. I know Eclipse and IntelliJ have plugins available.
There is another product called Fortify Software Security Center. It will allow you to keep scan results in a central place on the cloud. It is basically a repository of your scan results (the .fpr files). It makes it easier to see trends, and make comparisons between scans.
Here is the product announcement for the latest version as of this writing (18.20). In it you’ll find information about the new features, and links to documentation and samples.
Finally, I want to point out that there are free resources available to scan your Angular project, including them with tslint for example. However, if your company is already licensing Fortify for WebInspect (dynamic analysis), then most likely you also have access to the static code analyzer.
Come learn from community members and leaders the best ways to build reliable web applications, write quality code, choose scalable architectures, and create effective automated tests. Powered by ng-conf, join us for the Reliable Web Summit this August 26th & 27th, 2021.
https://reliablewebsummit.com/
20
