25
Hidden gems of the Chrome DevTools, Part 2: CSS tools
In the last article on the series we looked into some features of the Chrome Console API. This time we'll see some of the tools Chrome has to offer when working with CSS and layouts.
Chrome developer tools include handy tools for inspecting and debugging grid and flexbox layouts. When we open Chrome developer tools on the
Elements tab, you'll find a Layout tab right next to Styles and Computed. Under Layout we will see a listing of all the grids and all the flexbox layouts on the current page.
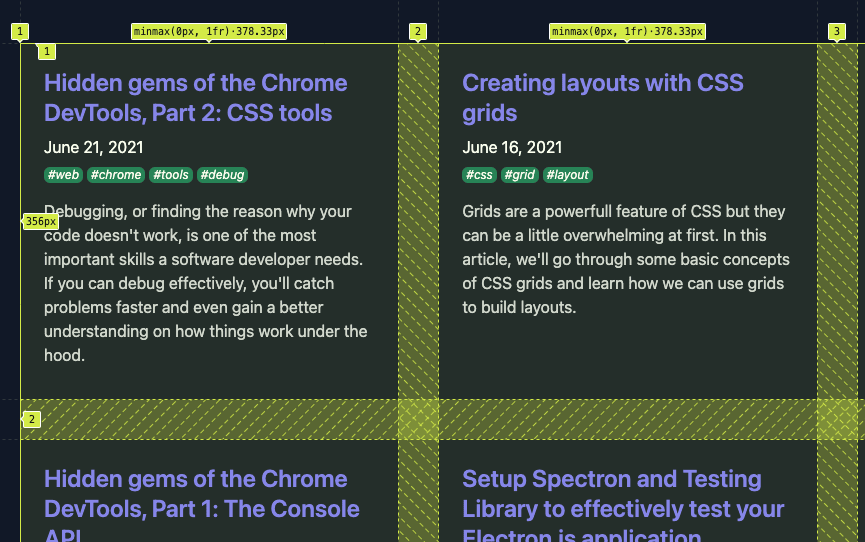
Clicking on one of the will enable a visual inspector for that layout as a overlay on the page. Here, I've enabled the inspector for the grid on the root of my site juhanajauhiainen.com.

By default the overlay displays line numbers, track sizes, and area names of the grid. The track size is displayed in the middle of the track (
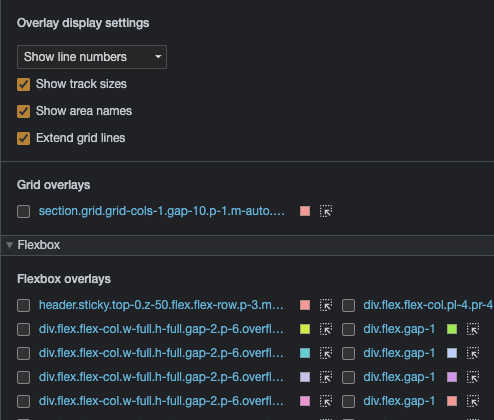
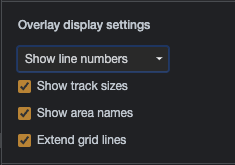
minmax(0px, 1fr) 378.33px), the line numbers are displayd at the left and top sides starting from 1. We can customize what is displayed, using the Overlay display settings.
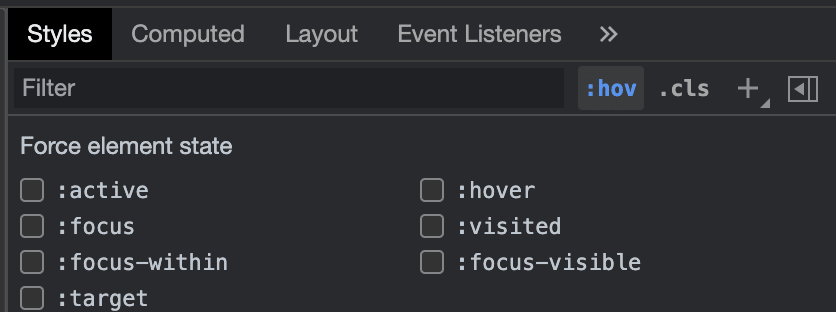
Under Elements -> Styles there's a cool feature which is easy to miss. While a DOM element is selected, you can force a state for it without actually triggering it. State here refers to interaction state such as, hover, focus, visited etc.

This helpful for example when we're testing different styles for a button or a link.
When you're inspecting CSS for a element, the colors are displayed with the color system they were defined with (hex, rgb, hsl). If you want to see how the color would be defined in another system, you can click the color indicator square while holding Ctrl+Cmd or Ctrl+Win to cycle through the different color systems.

Checkout the official Chrome developer tools documentation for further reading
Inspecting CSS grids
CSS tools reference
Inspecting CSS grids
CSS tools reference
Photo by Pierre Bamin on Unsplash
25
