32
How to Debug a React Context API App

Some time ago, I shared how I dropped Redux for the Context API when I’m creating a React application. The post got some great feedback, but I also had some people saying that it’s pretty hard to debug compared to the Redux DevTools and asking me if there is an easy method to do it.
The answer is yes. Actually, if there is something awesome about Redux, it’s the DevTools. The great part is we can link them easily with our Redux-free app — and with everything we like, really.
Let’s now see how it works!
When we have Redux DevTools installed, the extension automatically injects a special object (__REDUX_DEVTOOLS_EXTENSION__) in the window. A weird name for sure, but it prevents any conflicts with your existing code.
And that’s where everything starts: This object gives us everything we need — connect and disconnect methods that link our code with the Redux DevTools.
However, if you just try to run these functions, you will still see nothing in the DevTools because we first need to initiate the session.
To do so, we take advantage of the object that returns the connect method. It possesses an init method that launches the DevTools session.
Basically, it looks like this:
This file contains bidirectional Unicode text that may be interpreted or compiled differently than what appears below. To review, open the file in an editor that reveals hidden Unicode characters.
Learn more about bidirectional Unicode characters
| const devtools = window.__REDUX_DEVTOOLS_EXTENSION__.connect(); | |
| devTools.init(); | |
| window.__REDUX_DEVTOOLS_EXTENSION__.disconnect(); |
Even if this works, you will still see nothing in the DevTools because the session is closed as soon as we create it.
To make the session permanent when you are developing your app, you will need a Provider, which looks like this:
This file contains bidirectional Unicode text that may be interpreted or compiled differently than what appears below. To review, open the file in an editor that reveals hidden Unicode characters.
Learn more about bidirectional Unicode characters
| const ReduxDevtoolsProvider = ({ children }) => { | |
| const withDevTools = typeof window !== "undefined" && window.__REDUX_DEVTOOLS_EXTENSION__; | |
| let devTools; | |
| useEffect(() => { | |
| if (withDevTools) { | |
| devTools = window.__REDUX_DEVTOOLS_EXTENSION__.connect(); | |
| devTools.init(); | |
| return () => { | |
| window.__REDUX_DEVTOOLS_EXTENSION__.disconnect(); | |
| }; | |
| } | |
| return () => {}; | |
| }); | |
| return children; | |
| }; |
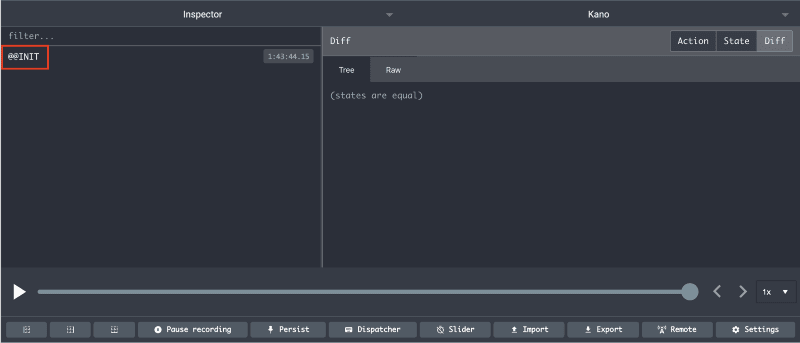
If you add this piece of code at the very top of your application, you will see the startup session in the Redux DevTools that you can identify with the @@INIT event that pops in.

Now that we are able to start a session, the next step is to send an event to the DevTools, which is as simple as we can imagine: The devTools object that we have created also provides a send method, which takes a name and some data to illustrate the change.
Basically, it looks like this:
This file contains bidirectional Unicode text that may be interpreted or compiled differently than what appears below. To review, open the file in an editor that reveals hidden Unicode characters.
Learn more about bidirectional Unicode characters
| const devtools = window.__REDUX_DEVTOOLS_EXTENSION__.connect(); | |
| devTools.init(); | |
| devtools.send("myName", { hello: "world!", some: "data" }); | |
| window.__REDUX_DEVTOOLS_EXTENSION__.disconnect(); |
We now have everything to make it work. We will just add a few things in our Provider to make it truly usable:
- A hook to allow simple event sending to the DevTools session.
- A Context API so the DevTools can be available in the whole project.
- A simple sending method with default name values.
This file contains bidirectional Unicode text that may be interpreted or compiled differently than what appears below. To review, open the file in an editor that reveals hidden Unicode characters.
Learn more about bidirectional Unicode characters
| import PropTypes from "prop-types"; | |
| import React, { useContext, useEffect } from "react"; | |
| const ReduxDevtoolsContext = React.createContext(); | |
| export const useReduxDevtools = (fct, name = fct.name) => { | |
| return useContext(ReduxDevtoolsContext)(fct, name); | |
| }; | |
| function useInternalReduxDevtools() { | |
| // eslint-disable-next-line no-underscore-dangle | |
| const withDevTools = typeof window !== "undefined" && window.__REDUX_DEVTOOLS_EXTENSION__; | |
| const devTools = { send: () => {} }; | |
| useEffect(() => { | |
| if (withDevTools) { | |
| // eslint-disable-next-line no-underscore-dangle | |
| devTools.current = window.__REDUX_DEVTOOLS_EXTENSION__.connect(); | |
| devTools.current.init(); | |
| return () => { | |
| // eslint-disable-next-line no-underscore-dangle | |
| window.__REDUX_DEVTOOLS_EXTENSION__.disconnect(); | |
| }; | |
| } | |
| return () => {}; | |
| }); | |
| return (fct, name) => { | |
| return (...args) => { | |
| devTools.current.send(name, args); | |
| return fct(...args); | |
| }; | |
| }; | |
| } | |
| const ReduxDevtoolsProvider = ({ children }) => { | |
| const tool = useInternalReduxDevtools(); | |
| return <ReduxDevtoolsContext.Provider value={tool}>{children}</ReduxDevtoolsContext.Provider>; | |
| }; | |
| ReduxDevtoolsProvider.propTypes = { | |
| children: PropTypes.node.isRequired | |
| }; | |
| export default ReduxDevtoolsProvider; |
The usage is now pretty simple in the application. We need to call the useReduxDevtools hook we created in the Provider file to wrap the initial method into a high-order function that handles the debug session:
This file contains bidirectional Unicode text that may be interpreted or compiled differently than what appears below. To review, open the file in an editor that reveals hidden Unicode characters.
Learn more about bidirectional Unicode characters
| import PropTypes from "prop-types"; | |
| import React, { createContext, useMemo, useState } from "react"; | |
| import { useReduxDevtools } from "./ReduxDevtoolProvider"; | |
| export const ThemeContext = createContext({ actions: {}, values: {} }); | |
| const ThemeProvider = ({ children }) => { | |
| const [theme, setLocalTheme] = useState("light"); | |
| const setTheme = useReduxDevtools(setLocalTheme, "setTheme"); | |
| const value = useMemo( | |
| () => ({ | |
| actions: { setTheme }, | |
| values: { theme } | |
| }), | |
| [theme, setTheme] | |
| ); | |
| return <ThemeContext.Provider value={value}>{children}</ThemeContext.Provider>; | |
| }; | |
| ThemeProvider.propTypes = { | |
| children: PropTypes.node.isRequired | |
| }; | |
| export default ThemeProvider; |

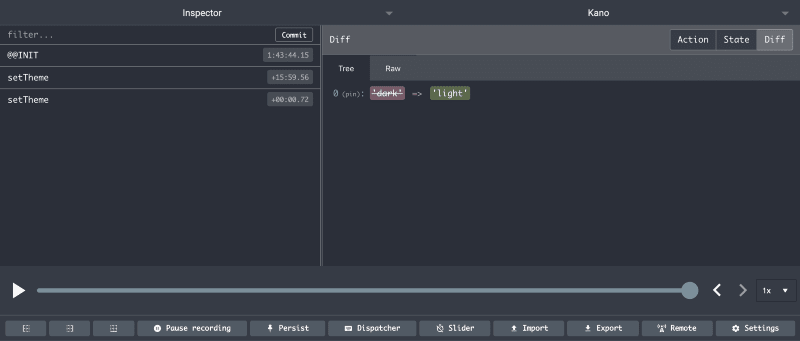
Now when we are calling the setTheme method, it pops in the DevTools so you can inspect what is going on!
It is very easy to connect any app to the Redux DevTools, and you can start debugging any app without Redux right now.
Also, let’s revisit something I said in my previous post about the Context API: It’s an easy API to use and can replace Redux in many cases, but keep in mind that Redux is much larger than the Context API. Choose wisely if you need to make the switch.
32
