How to set up Golang application performance monitoring with open source monitoring tool

If you want to check our Github repo before diving in 👇

GitHub logo SigNoz / signoz

SigNoz helps developers monitor their applications & troubleshoot problems, an open-source alternative to DataDog, NewRelic, etc. 🔥 🖥

SigNoz-logo

Monitor your applications and troubleshoot problems in your deployed applications, an open-source alternative to DataDog, New Relic, etc.

License Downloads GitHub issues tweet

SigNoz helps developers monitor applications and troubleshoot problems in their deployed applications. SigNoz uses distributed tracing to gain visibility into your software stack.

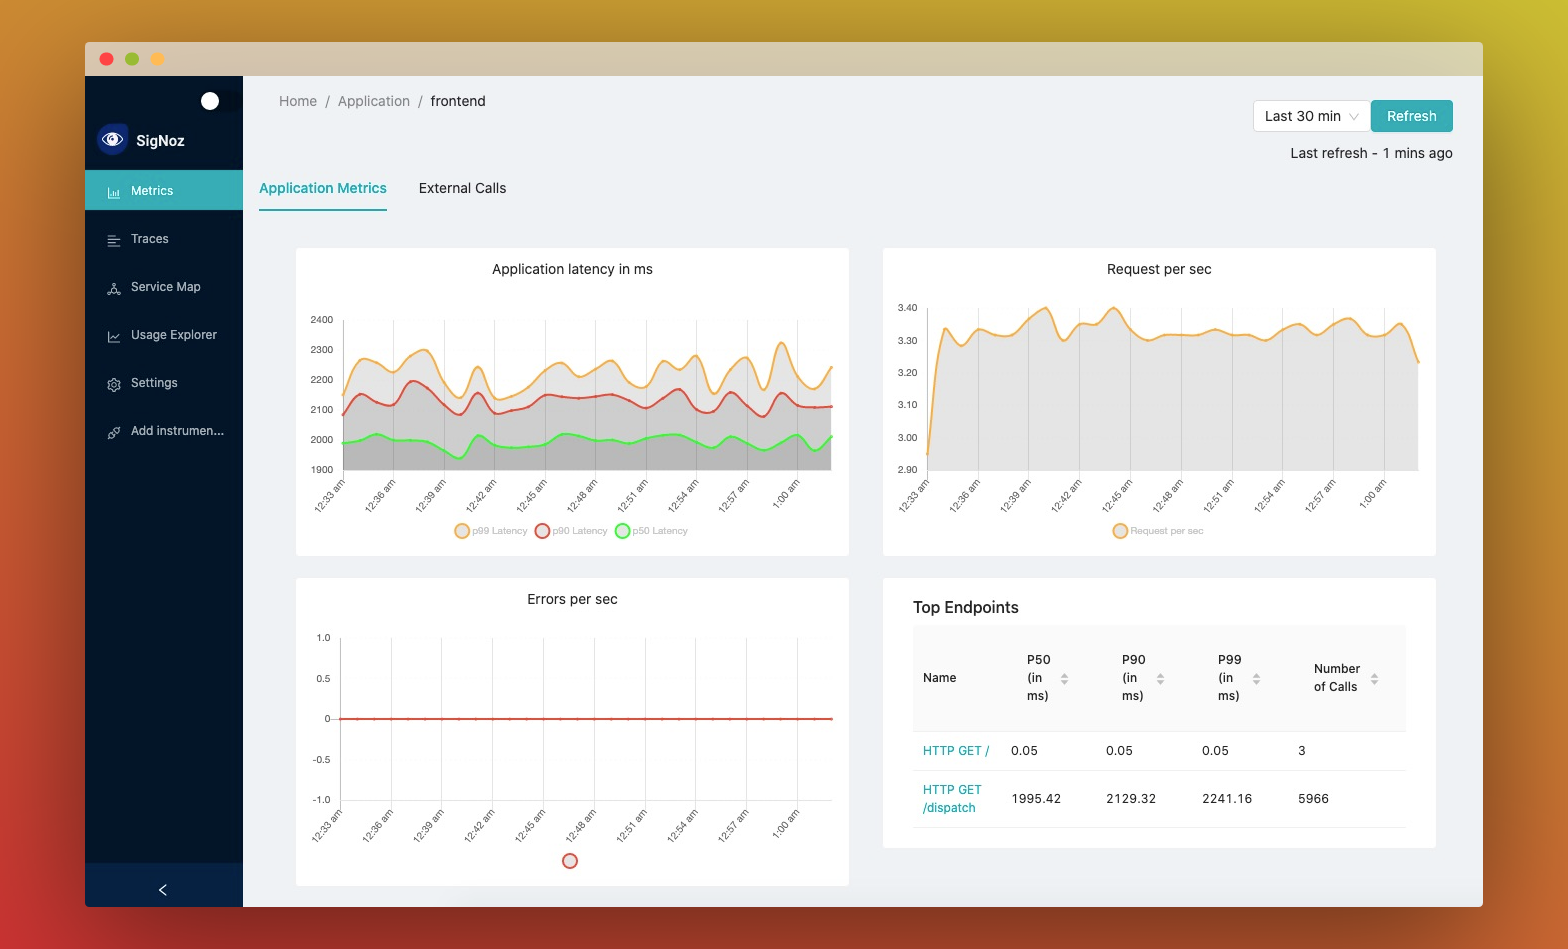
👉 You can see metrics like p99 latency, error rates for your services, external API calls and individual end points.

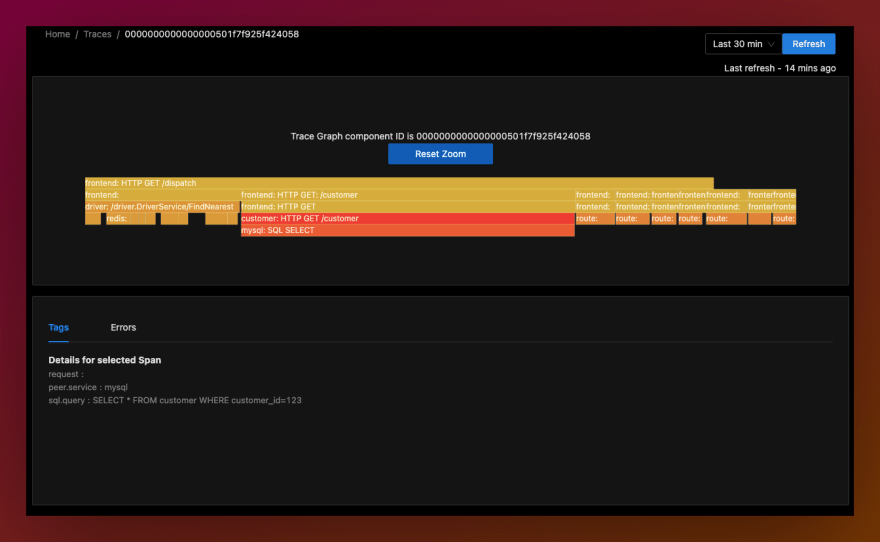
👉 You can find the root cause of the problem by going to the exact traces which are causing the problem and see detailed flamegraphs of individual request traces.

SigNoz Feature

👇 Features:

  • Application overview metrics like RPS, 50th/90th/99th Percentile latencies, and Error Rate
  • Slowest endpoints in your application
  • See exact request trace to figure out issues in downstream services, slow DB queries, call to 3rd party services like payment gateways, etc
  • Filter traces by service name, operation, latency, error, tags/annotations.
  • Aggregate metrics on filtered traces. Eg, you can get error…

Scalability, Reliability, Maintainability...

The list goes on for the benefits of microservices architecture in today's world. But along with these benefits also comes the challenges of complexity. How do you ensure your distributed infrastructure, which spans across servers, datastores, cloud vendors, and third-party APIs, is in fine health to meet customer requirements all the time?

A single user request may get routed through three, five, eighteen, or hundred different layers of services.

And it quickly becomes unrealistic for teams to identify which service was responsible for slowing a request down. Engineering teams need a system that brings context to this complexity. A system which enables quick identification of potential issues so that it can be resolved as quickly. And that's where there is a need for a robust monitoring framework.

Table of Contents

Introducing SigNoz

SigNoz is a full-stack open-source application monitoring and observability platform which can be installed within your infra. You can track metrics like p99 latency, error rates for your services, external API calls, and individual endpoints. With service maps, you can quickly assess the health of your services.

And once you know the affected service, trace data can help you identify the exact code causing the issue. Using SigNoz dashboard, you can visualize your traces easily with flamegraphs.

Now let's get down to some action and see everything for yourself.

We will divide the tutorial into two parts:

  1. Installing SigNoz
  2. Instrumenting sample app to start monitoring

Part 1 - Installing SigNoz

Install Docker
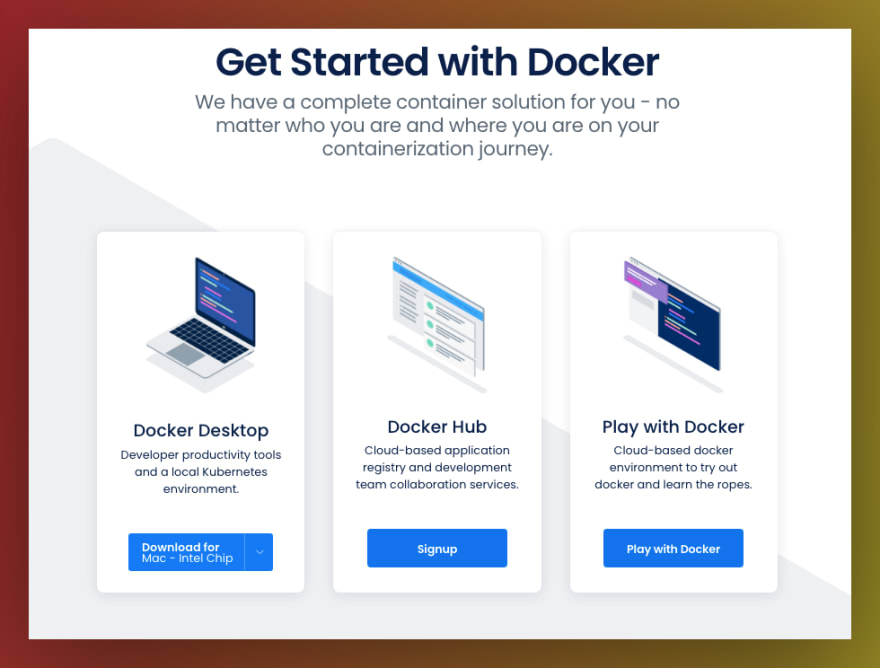
You can install Docker by following the steps listed on their website here. For this tutorial, you can choose the Docker Desktop option based on the system you have.

Clone SigNoz GitHub repository
From your terminal use the following command to clone SigNoz's GitHub repository.

git clone https://github.com/SigNoz/signoz.git

Update path to signoz/deploy and install SigNoz
The deploy folder contains the files necessary for deploying SigNoz through Docker.

cd signoz/deploy/
./install.sh

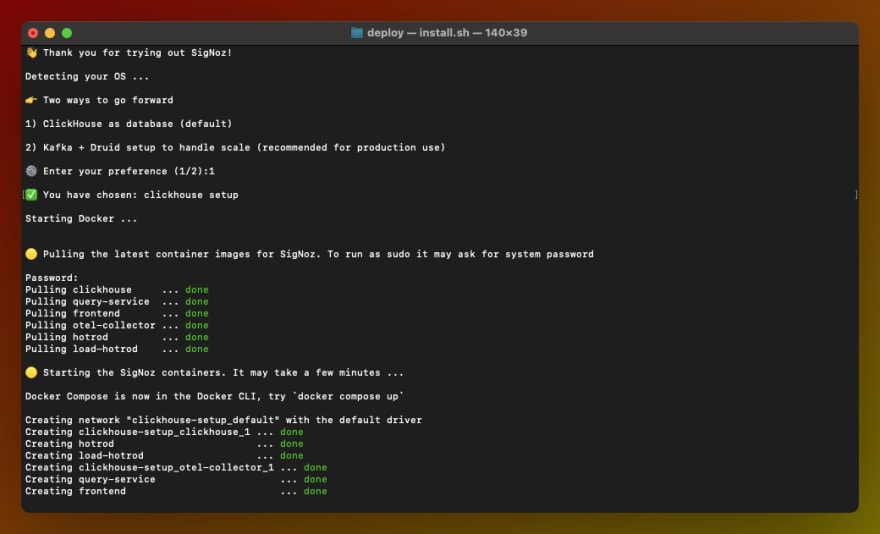
You will be asked to select one of the 2 ways to proceed:

  1. Clickhouse as database (default)
  2. Kafka + Druid setup to handle scale (recommended for production use)

Trying out SigNoz with clickhouse database takes less than 1.5GB of memory and for this tutorial, we will use that option.

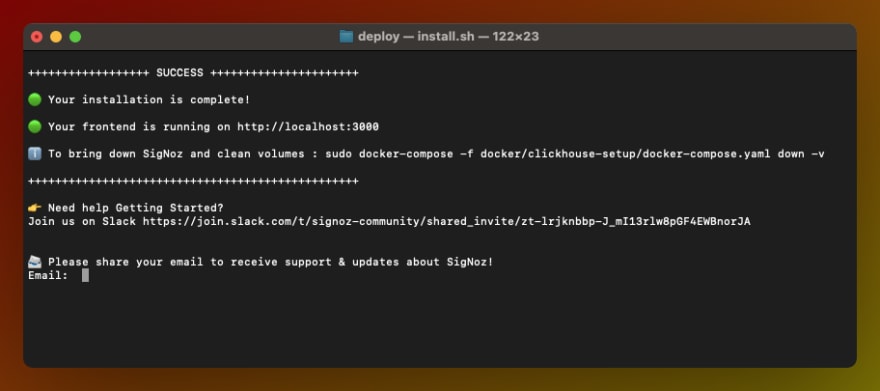
You will get the following message once the installation is complete.

Once the installation runs successfully, the UI should be accessible at port 3000. Wait for 2-3 mins for the data to be available to frontend.

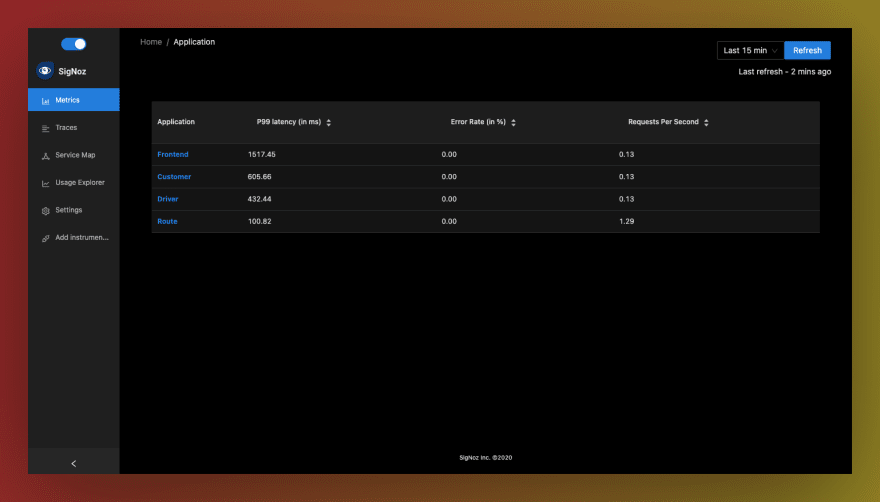
The applications shown in the dashboard are from a sample app called Hot R.O.D that comes with the installation bundle. It has 4 microservices being monitored: Frontend, Customer, Driver and Route. You can access the Hot R.O.D application UI at: http://localhost:9000/

Now that you have SigNoz up and running, let's see how instrumentation works. Instrumentation is the process of implementing code instructions to monitor your application's performance. Instrumentation is key to see how your application handles the real world. It helps you generate trace data which you can then use to understand what's happening inside your systems.

SigNoz supports OpenTelemetry as the primary way for users to instrument their application. OpenTelemetry is a single, vendor-agnostic instrumentation library with support for both automatic and manual instrumentation. More details on OpenTelemetry Golang SDKs and APIs here.

Part 2 - Instrumenting sample Golang app

To see how SigNoz can start reporting data of a Golang app, let's see how it works with a sample bookstore app (GitHub repo).

It is a simple bookstore app with a REST API that provides book data and performs CRUD operations. The app uses Gin framework to build a RESTful API. Gin is a high-performance HTTP web framework written in Golang containing a set of commonly used functionalities like routing, middleware support and rendering.

OpenTelemetry has specific instrumentation packages to support popular Golang packages and use cases. For example, this app uses the Gin framework for request routing. OpenTelemetry provides instrumentation package named otelgin to instrument the Gin framework which you need to import in your app. You can find the complete list of supported Golang packages by OpenTelemetry here.

Prerequisites
Verify if you have Golang installed on your machine by running $ go version on your terminal. If you don't have Golang installed, you can download it here.

Steps

Clone sample Golang app repository
From your terminal use the following command to clone sample Golang app GitHub repository.

git clone https://github.com/SigNoz/sample-golang-app.git

Update path to sample-golang-app & check if the app is working
Update your terminal path to the sample app directory and check if the app is working or not using the following command:

cd sample-golang-app
go run main.go

Make sure you have an available port for running your app. If by default, the golang app tries to run on port 8080, you might get an error as SigNoz uses port 8080 for its query service. On your mac terminal, you can set the listening port of your app by using following command:

export PORT = 8081

When the server runs successfully, you can check the endpoint of your sample bookstore app at: http://localhost:8081/books

If you see an empty array, it means your application is working. You can check out how to write, update and delete books in your array from the article here.

Once you ensure that your application is working, exit the server by pressing 'Ctrl + C' on your mac terminal.

Set up OpenTelemetry Golang instrumentation packages
The file main.go has instructions to import all the necessary OpenTelemetry packages in order to instrument the sample app. For this app, we import the following OpenTelemetry packages.

import (
    "go.opentelemetry.io/contrib/instrumentation/github.com/gin-gonic/gin/otelgin"
    "go.opentelemetry.io/otel"
    "go.opentelemetry.io/otel/exporters/otlp"
    "go.opentelemetry.io/otel/exporters/otlp/otlpgrpc"
    "go.opentelemetry.io/otel/label"

    "go.opentelemetry.io/otel/sdk/resource"
    sdktrace "go.opentelemetry.io/otel/sdk/trace"
)

You just need to run it with the necessary environment variables in order to start sending data to SigNoz. Use the following command to run and configure the app to send data to SigNoz:

SERVICE_NAME=goApp INSECURE_MODE=true OTEL_EXPORTER_OTLP_ENDPOINT=<IP of SigNoz backend>:4317 go run main.go

'Ip of SigNoz' can be replaced with localhost in this case. Hence, the final command becomes:

SERVICE_NAME=goApp INSECURE_MODE=true OTEL_EXPORTER_OTLP_ENDPOINT=localhost:4317 go run main.go

And, congratulations! You have instrumented your sample Golang app. Hit the /books endpoint of the bookstore app at http://localhost:8081/books. Refresh it a bunch of times in order to generate load, and wait for 1-2 mins for data to appear on SigNoz dashboard.

You can now access the SigNoz dashboard at http://localhost:3000 to monitor your app for performance metrics.

If you want to instrument your own Golang application, you can read about it in our documentation.

Using SigNoz dashboard to identify issues causing high latency in your app

Now that you have installed SigNoz, let's see how you can identify specific events causing high latency in your deployed applications.

In just 5 easy steps, our dashboard lets you drill down to events causing a delay in your deployed apps 👇

  1. Choose the service you want to inspect
    List of application on SigNoz dashboard

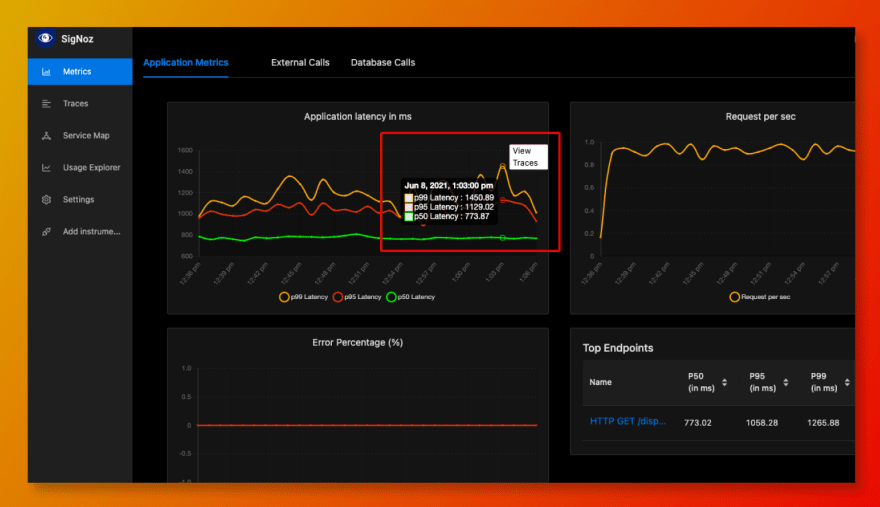
  2. Choose the timestamp where latency is high and click on view traces
    Inspect latency graph and click on view traces for high latency timestamps

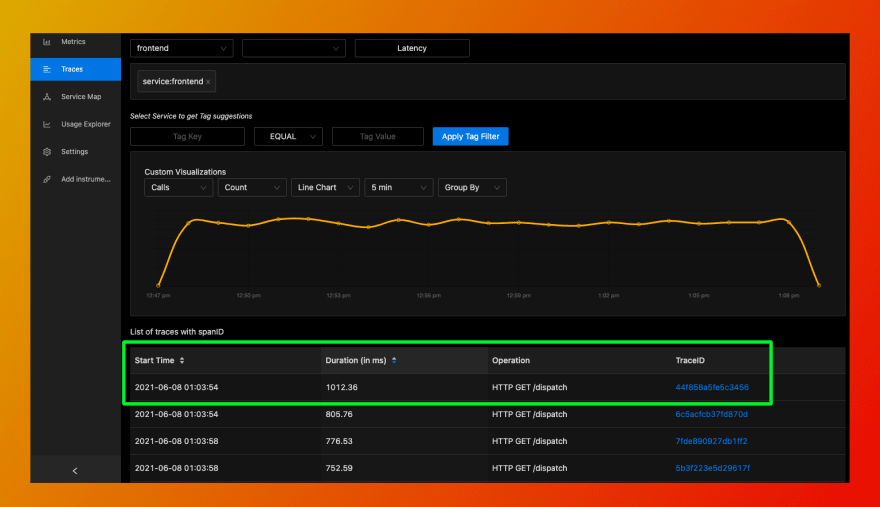
  3. Choose the trace ID with the highest latency
    Sort and choose the trace ID with highest latency

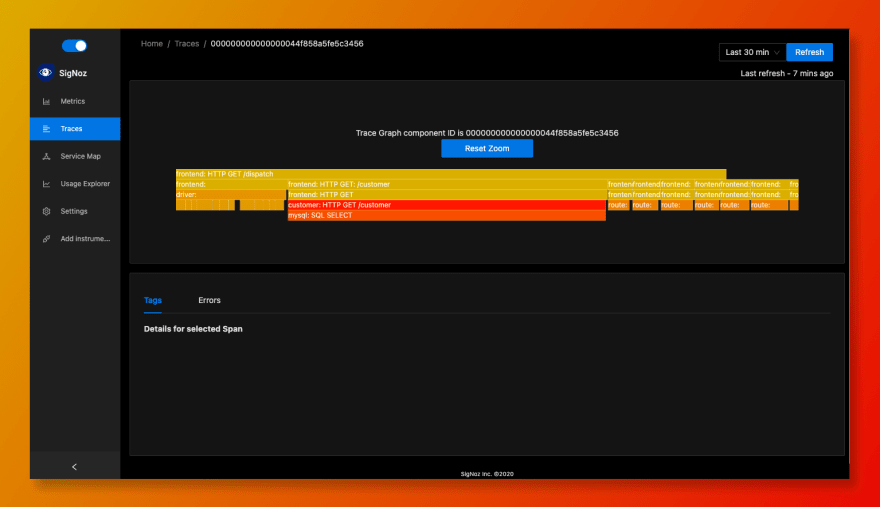
  4. Inspect distributed traces with flamegraph
    Flamegraphs

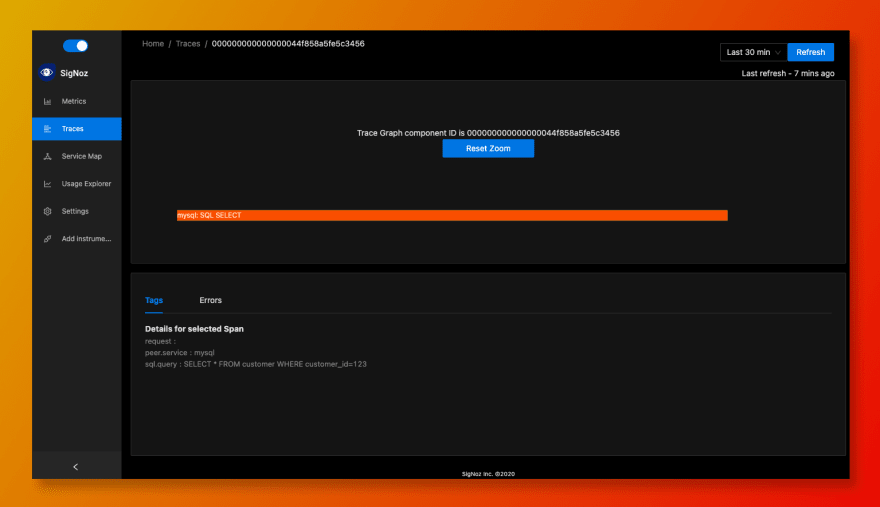
  5. Zero in on the highest latency event and take action
    Identify specific event causing the delay

If you need any help with trying out SigNoz, feel free to mail me at [email protected].

Check out our documentation for more installation guides and troubleshooting instructions.

They say, "If it's not monitored, then it's not in production." And with SigNoz you can start monitoring your applications now. Enabling your team to resolve issues quickly in production is critical to maintaining complex distributed systems in fine health.

At SigNoz, we are committed to making the best open-source, self-hosted tool for application performance monitoring. Feel free to check out our GitHub repo here:

GitHub logo SigNoz / signoz

SigNoz helps developers monitor their applications & troubleshoot problems, an open-source alternative to DataDog, NewRelic, etc. 🔥 🖥

SigNoz-logo

Monitor your applications and troubleshoot problems in your deployed applications, an open-source alternative to DataDog, New Relic, etc.

License Downloads GitHub issues tweet

SigNoz helps developers monitor applications and troubleshoot problems in their deployed applications. SigNoz uses distributed tracing to gain visibility into your software stack.

👉 You can see metrics like p99 latency, error rates for your services, external API calls and individual end points.

👉 You can find the root cause of the problem by going to the exact traces which are causing the problem and see detailed flamegraphs of individual request traces.

SigNoz Feature

👇 Features:

  • Application overview metrics like RPS, 50th/90th/99th Percentile latencies, and Error Rate
  • Slowest endpoints in your application
  • See exact request trace to figure out issues in downstream services, slow DB queries, call to 3rd party services like payment gateways, etc
  • Filter traces by service name, operation, latency, error, tags/annotations.
  • Aggregate metrics on filtered traces. Eg, you can get error…

27