49
pg_hint_plan and single-table cardinality correction
Here is a little post about pg_hint_plan to set the cardinality estimations for the PostgreSQL query planner. The postgres optimizer can do great estimations when provided the correct statistics, and this cost based optimization is best approach as it adapts to the change of data. However, for a stable OLTP application, you want to keep it stable. And providing the cardinalities in the query may be a way to achieve that. Note that you don't need to provide the exact number of rows, but a relevant model for the data access order and path.
$ psql postgres://franck:switzerland@yb1.pachot.net:5433/yb_demo_northwind
psql (14beta1, server 11.2-YB-2.7.1.1-b0)
Type "help" for help.

yb_demo_northwind=>
Here is an example where we have no statistics. I'm using YugabyteDB here, which plugs a distributed document store (DocDB) to PostgreSQL, querying though the Foreign Data Wrapper. I'm over-simplifying things here to keep the focus on the topic.
The point is that, in the current version (YB-2.7), we have no table statistics and the query planner uses a default of 1000 rows:
The point is that, in the current version (YB-2.7), we have no table statistics and the query planner uses a default of 1000 rows:
yb_demo_northwind=> explain (analyze, summary false) select * from orders;

                                                 QUERY PLAN
-------------------------------------------------------------------------------------------------------------
 Seq Scan on orders  (cost=0.00..100.00 rows=1000 width=472) (actual time=128.102..129.019 rows=830 loops=1)
(1 row)

yb_demo_northwind=> explain (analyze, summary false) select * from orders where ship_country='Switzerland';

                                                QUERY PLAN
----------------------------------------------------------------------------------------------------------
 Seq Scan on orders  (cost=0.00..102.50 rows=1000 width=472) (actual time=90.315..91.300 rows=18 loops=1)
   Filter: ((ship_country)::text = 'Switzerland'::text)
   Rows Removed by Filter: 812
(3 rows)
I'm using EXPLAIN here with the following:
So, when a rowset is read, except when the query planner knows there's only one row because of unique constraint, the estimation is: rows=1000. This may seem too simple, but:
In PostgreSQL you have to install the pg_hint_plan extension, and enable it. The PostgreSQL community fears that it is incorrectly used, and that people do not report, to the community that maintains the query planner, the issues encountered with bad optimizer estimations. And the risk is that people just workaround the issue with hints without addressing the root cause. Even if also Open Source, Yugabyte is in a different position. The users know that this database is new, in very active development, and interact with us though Slack or GitHub. Then, it is acceptable to test a different plan with hints, report the issue, leave the hints for a short term workaround until the issue is fixed. In addition to that, the fixed version will be easy to deploy without downtime as YugabyteDB is a distributed database which supports easy rolling upgrade.
In YugabyteDB, the pg_hint_plan is installed and enabled by default:
yb_demo_northwind=> show pg_hint_plan.enable_hint;
 pg_hint_plan.enable_hint
-------------------------------
 on
(1 row)

yb_demo_northwind=> show pg_hint_plan.message_level;
 pg_hint_plan.message_level
---------------------------------
 log
(1 row)
The pg_hint_plan extension can add hints to control the plan operations (Scan or Index access, Join order and methods, but can also correct the cardinality estimation with the "Rows" hint. You can think of it as the OPT_ESTIMATE() hint in Oracle. However, in the current version, pg_hint_plan Rows() hint operates only on a join result:
yb_demo_northwind=> explain (analyze, summary false) select /*+ Rows(o #42) */ * from orders o where ship_country='Switzerland';
INFO:  pg_hint_plan: hint syntax error at or near " "
DETAIL:  Rows hint requires at least two relations.
                                                 QUERY PLAN
-----------------------------------------------------------------------------------------------------------------
 Seq Scan on orders o  (cost=0.00..102.50 rows=1000 width=472) (actual time=26.114..27.103 rows=18 loops=1)
   Filter: ((ship_country)::text = 'Switzerland'::text)
   Rows Removed by Filter: 812
(3 rows)
This shows a syntax error and ignores the hint. Always look at the messages when you are using hints and validate the result. Here I still have the default rows=1000.
I'm writing here a quick workaround which is not satisfying at all. I'm mentioning it for short-term solution, and to see if someone has a better approach, or maybe will contribute to pg_hint_plan to add this single-table cardinality correction. And, anyway, ugly workarounds can be used temporarily when you understand the consequences.
yb_demo_northwind=> explain (analyze, summary false)
  /*+ Leading(dummy o) Rows(dummy o #42) */
  select * from (select 1 limit 1) dummy, orders o where ship_country='Switzerland';
                                                    QUERY PLAN
-----------------------------------------------------------------------------------------------------------------------
 Nested Loop  (cost=0.00..112.52 rows=42 width=476) (actual time=24.733..25.807 rows=18 loops=1)
   ->  Limit  (cost=0.00..0.01 rows=1 width=4) (actual time=0.671..0.673 rows=1 loops=1)
         ->  Result  (cost=0.00..0.01 rows=1 width=4) (actual time=0.001..0.001 rows=1 loops=1)
   ->  Seq Scan on orders o  (cost=0.00..102.50 rows=1000 width=472) (actual time=23.997..25.066 rows=18 loops=1)
         Filter: ((ship_country)::text = 'Switzerland'::text)
         Rows Removed by Filter: 812
(6 rows)

yb_demo_northwind=> explain (analyze, summary false)
 /*+ Leading(dummy o) Rows(dummy o #42) */
 with dummy as (values (1))
 select o.* from dummy, orders o where ship_country='Switzerland';
                                                    QUERY PLAN
-----------------------------------------------------------------------------------------------------------------------
 Nested Loop  (cost=0.01..112.53 rows=42 width=472) (actual time=24.089..25.115 rows=18 loops=1)
   CTE dummy
     ->  Result  (cost=0.00..0.01 rows=1 width=4) (actual time=0.001..0.002 rows=1 loops=1)
   ->  CTE Scan on dummy  (cost=0.00..0.02 rows=1 width=0) (actual time=0.004..0.005 rows=1 loops=1)
   ->  Seq Scan on orders o  (cost=0.00..102.50 rows=1000 width=472) (actual time=24.070..25.091 rows=18 loops=1)
         Filter: ((ship_country)::text = 'Switzerland'::text)
         Rows Removed by Filter: 812
(7 rows)
You can see two variations with a subselect and with a WITH clause (CTE). Both of those add a Nested Loop and, even if the actual cost is negligible, it adds 10 to the estimated cost.
Note that Rows() can take a correction rather than an absolute value. If you use this with a table that already has statistics, it is probably better to adjust the estimated cost so that it follows the table growth but keeps the correction. See pg_hint_plan documentation
The correction for one table is probably not very useful. But it can make a huge difference when there is a further join.
Here is an example:
yb_demo_northwind=> explain (analyze, summary false)
  select o.* from orders o join order_details d using (order_id) where ship_country='Switzerland';
                                                           QUERY PLAN
--------------------------------------------------------------------------------------------------------------------------------------
 Nested Loop  (cost=0.00..218.88 rows=1000 width=472) (actual time=190.386..3890.738 rows=52 loops=1)
   ->  Seq Scan on order_details d  (cost=0.00..100.00 rows=1000 width=2) (actual time=11.991..14.555 rows=2155 loops=1)
   ->  Index Scan using orders_pkey on orders o  (cost=0.00..0.12 rows=1 width=472) (actual time=1.656..1.656 rows=0 loops=2155)
         Index Cond: (order_id = d.order_id)
         Filter: ((ship_country)::text = 'Switzerland'::text)
         Rows Removed by Filter: 1
(6 rows)
Here, because there's no statistics, the query planner estimates all tables with rows=1000 and decides to start with the "order_details" table. However, this is not efficient: reading all order details, then joining with "orders" and, only then, filtering on "ship_country".
The 2 thousand loops take time, especially in a distributed database where rows can come from different nodes. I'm running on a very small machine here in OCI free tier which I keep open, so you can copy paste everything, including the connection string, and test yourself. Of course, you can also install YugabyteDB easily: https://docs.yugabyte.com/latest/quick-start
I can add a hint like Rows(dummy o *0.2) to tell the query planner that my filtering on "ship_country" has a high selectivity:
yb_demo_northwind=> explain (analyze, summary false)
 /*+ Rows(dummy o *0.2) Rows(dummy d *1) */
 with dummy as (values (1))
 select o.* from dummy, orders o join order_details d using (order_id) where ship_country='Switzerland';
                                                                                                                           QUERY PLAN
-----------------------------------------------------------------------------------------------------------------------------------
 Hash Join  (cost=115.03..220.78 rows=200 width=472) (actual time=32.111..33.552 rows=52 loops=1)
   Hash Cond: (d.order_id = o.order_id)
   CTE dummy
     ->  Result  (cost=0.00..0.01 rows=1 width=4) (actual time=0.001..0.002 rows=1 loops=1)
   ->  Seq Scan on order_details d  (cost=0.00..100.00 rows=1000 width=2) (actual time=6.930..8.147 rows=2155 loops=1)
   ->  Hash  (cost=112.52..112.52 rows=200 width=472) (actual time=25.141..25.141 rows=18 loops=1)
         Buckets: 1024  Batches: 1  Memory Usage: 11kB
         ->  Nested Loop  (cost=0.00..112.52 rows=200 width=472) (actual time=24.171..25.123 rows=18 loops=1)
               ->  CTE Scan on dummy  (cost=0.00..0.02 rows=1 width=0) (actual time=0.003..0.004 rows=1 loops=1)
               ->  Seq Scan on orders o  (cost=0.00..102.50 rows=1000 width=472) (actual time=24.139..25.086 rows=18 loops=1)
                     Filter: ((ship_country)::text = 'Switzerland'::text)
                     Rows Removed by Filter: 812
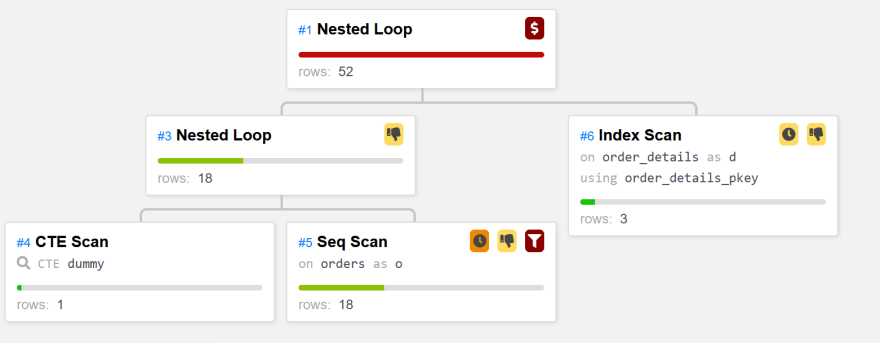
Here the execution is much faster, avoiding the nested loop from "order_details". You may be surprised to see the whole "order_details" scanned and hashed, but remember this is a distributed database where this table is sharded to many tablets. With an even lower selectivity like Rows(dummy o #5) which optimizes for 5 rows coming from "orders" you can see a nested loop from there. Here it is as displayed by the Dalibo plan visualizer to add some colors to this post:

This is the correct access and all I had to do, in addition to adding this dummy CTE, is mentioning the unaccounted selectivity of 20%. I also mentioned that the selectivity when starting with "order_details" is 100% with Rows(dummy d *1). This doesn't change anything here, but it is important to think about all possible join order the query planner may consider, and be sure your hint match all of them. I could also have added Rows(dummy o d *3) to mention that there are on average 3 "order_details" for each "order". I could also have decided to go with exact numbers like Rows(dummy o #18) Rows(dummy d #2155) Rows(dummy o d *2.5) which, even if the table change, keeps the right balance for the join method decision. Finally, I didn't hint the join paths that does not start with my dummy CTE as I expect the query planner to always start there (it knows there is only one row thanks to the VALUE or LIMIT construct).

This is the correct access and all I had to do, in addition to adding this dummy CTE, is mentioning the unaccounted selectivity of 20%. I also mentioned that the selectivity when starting with "order_details" is 100% with Rows(dummy d *1). This doesn't change anything here, but it is important to think about all possible join order the query planner may consider, and be sure your hint match all of them. I could also have added Rows(dummy o d *3) to mention that there are on average 3 "order_details" for each "order". I could also have decided to go with exact numbers like Rows(dummy o #18) Rows(dummy d #2155) Rows(dummy o d *2.5) which, even if the table change, keeps the right balance for the join method decision. Finally, I didn't hint the join paths that does not start with my dummy CTE as I expect the query planner to always start there (it knows there is only one row thanks to the VALUE or LIMIT construct).
Reminder: hints are workarounds when the query planner cannot estimate the cardinality correctly and you want to help it with your knowledge on cardinality and selectivity that statistics cannot show. And adding a CTE is another workaround on top of it.
49
