39
CodeGuru Profiler
In this final part, we will create CodeGuru Profiler groups. This is where you can see the data of Profiling.
Go to the CodeGuru console: https://console.aws.amazon.com/codeguru
Select Profiling groups from the Profiler on the left menu. Then select concurrencysample-profiler.

You can see the analysis by CodeGuru Profiler. You can estimate the amount of time, percent, and cost per function. In addition, the results of profiling can be analyzed to provide reports that require improvement.

An overview visualization can help you find specific call stacks that lead to inefficient code. You can find code that is running on the CPU by looking for flat tops in the visualization. It is an area where the CPU is doing work directly in that function and not a callee.

A hotspots visualization can be used to investigate functions that are by themselves computationally expensive. It shows a top-down view of your profile. The functions consuming the most application time are at the top of the visualization. At the bottom of the visualization are the entry point functions.

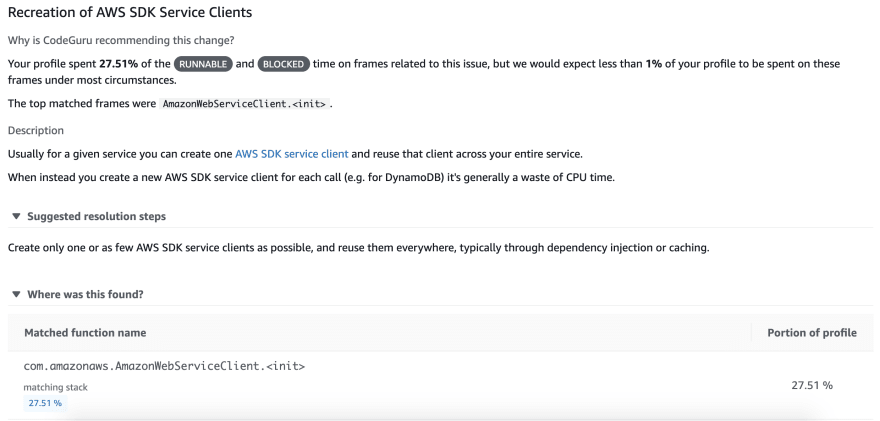
Amazon CodeGuru Profiler makes recommendations you can use to optimize your applications. Each recommendation includes information about why the recommendation was made, a description, suggested resolution steps, and the stack locations that were the source of the recommendation.

Reusing the AWS Client seems to be able to more optimize the program. You can optimize the software using this variety of information.
Now that the training is finish! Congrats and thank you for bearing with me. <3 :D
39
