
14
How to handle missing Values in a dataset using Python.
Missing data, or missing values, occur when no data value is stored for the variable in an observation.
- Absence of data reduces statistical power, which refers to the probability that the test will reject the null hypothesis when it is false.
- The lost data can cause bias in the estimation of parameters.
- Reduces the representativeness of the samples.
- Absence of data may complicate the analysis of the study.
The above effects may lead to invalid conclusions. To avoid this we will look at different ways and techniques of handling missing values using python programming language.
In this article we will work with Melbourne Housing dataset from kaggle.
Let's now import the dataset as follows:
import pandas as pd
import numpy as np
df=pd.read_csv('melb_data.csv')
df
Now lets find out if there are missing values in our data;
#sum() returns the number of missing values in the data set.
df.isnull().sum()
From the above output, we find out that the following columns have missing values.
BuildingArea
YearBuilt
CouncilArea
We can also use df.info() function to find out the number of non-null values in each column.
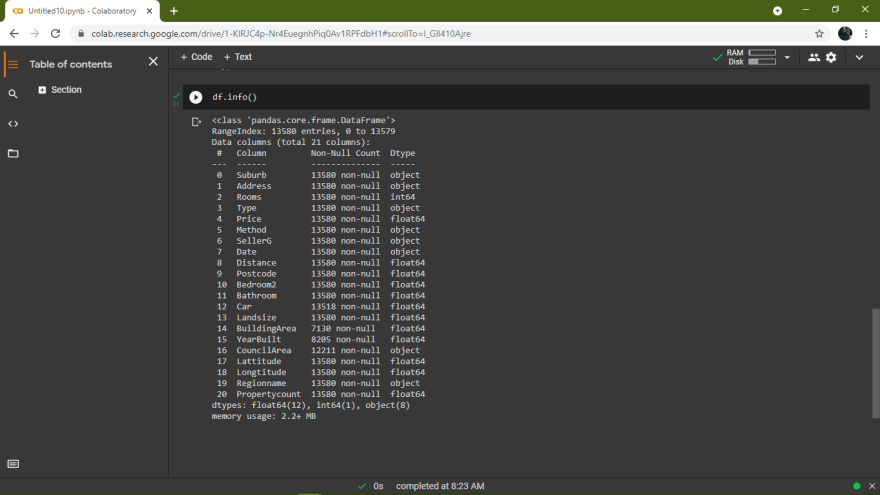
From the above output we can see that
BuildingArea, YearBuilt, CouncilArea columns are incomplete.
1.Deleting the columns/rows with missing data
In this case lets delete the columns with missing values as follows;
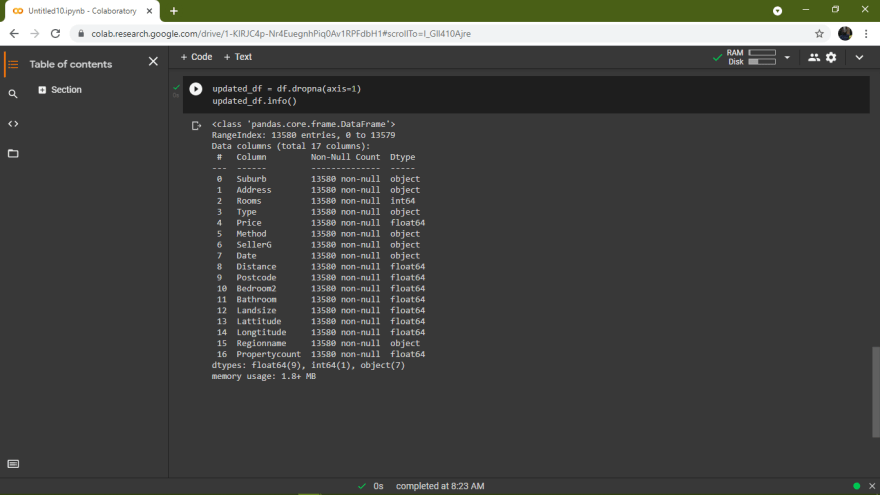
Also if there is a certain row with missing data, then you can delete the entire row with all the features in that row.
axis=1 is used to drop the column with
NaNvalues.axis=0 is used to drop the row with
NaNvalues.
2.Filling the missing data with a value- Imputation
Removing the rows and columns containing missing data may not be the best approach since they might contain valuable data.
Instead, we can fill the missing data using the following common ways;
- Filling missing data with mean and median of the data if its a numerical variable.
In this case we will use the fillna() function to fill missing values in 'BuildingArea' and 'YearBuilt' columns using mean since they are numerical values.
df['BuildingArea'].fillna(int(df['BuildingArea'].mean()), inplace=True)
df['YearBuilt'].fillna(int(df['YearBuilt'].mean()), inplace=True)

df.info()- Filling the missing data with mode if it’s a categorical value.
df['CouncilArea'].fillna(df['CouncilArea'].mode(), inplace=True)- Fill Missing data with a Constant
df['BuildingArea'].fillna(0, inplace=True)
df['YearBuilt  '].fillna(0, inplace=True)
3.Imputation with an additional column
Use the SimpleImputer() function from sklearn module to impute the values.
To use SimpleImputer() pass the strategy as an argument to function. It can be either mean, mode or median.
The default is mean.
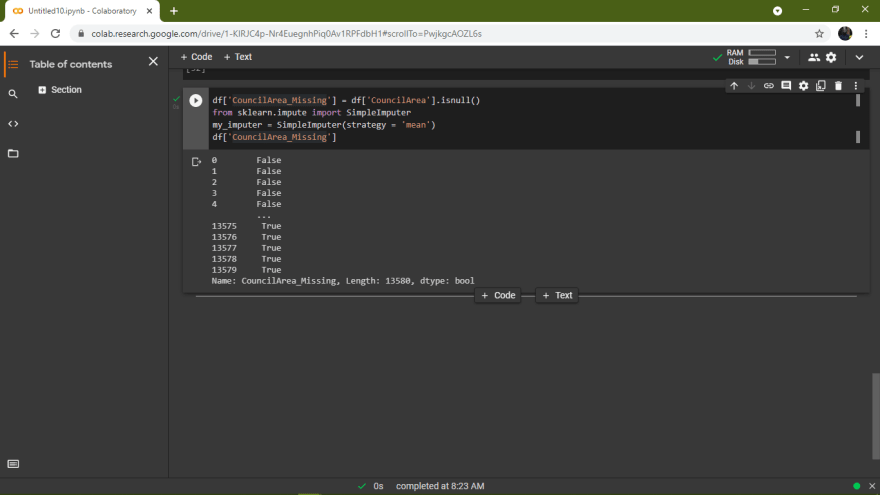
df['CouncilArea_Missing'] = df['CouncilArea'].isnull()
from sklearn.impute import SimpleImputer
my_imputer = SimpleImputer(strategy = 'mean')
df['CouncilArea_Missing']
The above code with add an additional column 'CouncilArea_Missing' with True as value, if it is a null value and False if it is not a null value.
The above are just few ways of handling missing values. You can experiment through them and many others to find the best approach that can work for your data.
Thank you for reading the article 🥳🥳🥳.
14