21
Azure Event Hub logging, monitoring and alerting
Introduction
Azure Event Hub is an event ingestion service and a big data streaming platform. It is highly scalable and capable of processing millions of events per second. Azure Event Hub is simple, secures the real-time data and can easily connect millions of devices across platforms.
With this quick introduction, let us understand the following key concepts
Event Producers
Event producers can send events via protocols like HTTP or AMQP. The events sent from the event producers are moved to the Event Hub and each Event Hub is partitioned, which ranges from 1 to 32 partitions.
Partition Key
The partition key helps in processing the events in order.
Event Consumer
Event Consumer reads data from an Event hub.
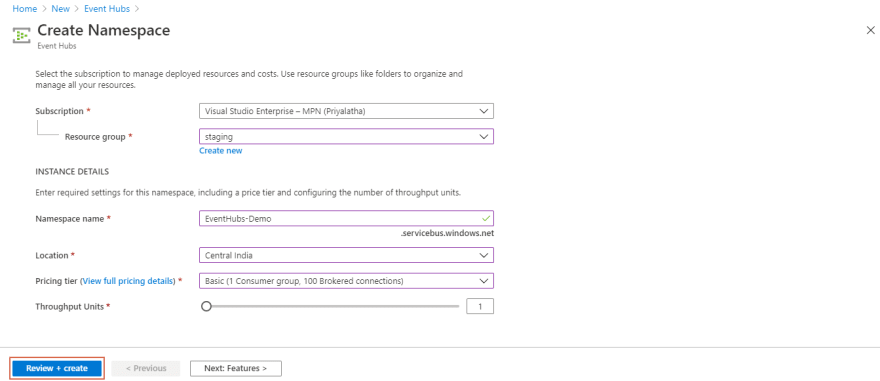
Create a Namespace
The very first step in creating an Event Hub is the creation of the Namespace with the details below
• Subscription- Choose from the available
• Resource group- Use existing or create new
• Name- to identify
• Location- as per user base
• Pricing tier- The Standard tier of Azure Event Hubs provides features beyond what is available in the Basic tier.
The following features are included with Standard
• Longer event retention
• Additional brokered connections, with an overage charge
for more than the number included
• More than a single consumer group
• Capture
• Kafka integration(Event Hubs for Kafka)
• Throughput Units – controls the Event Hubs traffic. A single throughput unit allows 1 MB per second of ingress and twice that amount of egress. Standard Event Hubs can be configured with 1-20 throughput units. Auto-inflate enables you to start small with the minimum required throughput units you choose.

Once Event Hub namespace is created, Event Hub can be created with the following configurations
• Name
• Partition count
• Message Retention period

Sending Events
Events can be sent to the Azure Event Hub by using Visual Studio 2019.
Here .NET is used to send messages to Event Hubs,
• Create a Console Application.
• Install NuGet Package, MicrosoftAzureServiceBus to enable connecting to Event Hub
Add the following using statements,
using System.Threading;
using Microsoft.ServiceBus.Messaging;

You can add the following code under the Main method,
var eventHubClient = EventHubClient.CreateFromConnectionString(connectionString, eventHubName);
while (true)
{
try
{
Console.WriteLine("{0} > Sending message: {1}", DateTime.Now, "My Event");
eventHubClient.Send(new EventData(Encoding.UTF8.GetBytes("My Event")));
}
catch (Exception exception)
{
Console.ForegroundColor = ConsoleColor.Red;
Console.WriteLine("{0} > Exception: {1}", DateTime.Now, exception.Message);
Console.ResetColor();
}
Thread.Sleep(200);
}
Once you run the console application, the events are sent to the Event Hubs.
Send Events to Event Hub from Serverless360
A smarter alternative to the solution above is the Send Event Automated task for Event Hubs in Serverless360. One can simulate a real-time scenario by triggering a huge number of events to an Event Hub without writing a single line of code. The Serverless360 GUI encapsulates the underlying complexity and hence improves operational efficiency.

How Do I Monitor My Azure Event Hub?
Azure Event Hub can be monitored from Azure portal using the Azure metrics or you can even use Serverless360 to perform monitoring. Now lets have a deep discussion on both of these monitoring offerings.
Monitoring Azure Event Hubs in Azure Portal
Microsoft Azure offers entity level monitoring where the monitoring is done based on the metrics enabled. Incoming requests, outgoing requests, and successful requests are captured under the metrics section. You can also filter those metrics based on the aggregation value. For example, you can filter your Incoming requests based on the count.

Logging in Event Hubs
Azure Event Hubs logging provides information about the operations done under the Event Hub namespace. Azure Event Hubs have two types of logs namely, Activity Logs and Diagnostic Logs.
Activity Log
Activity logs capture all the actions that are performed on a task and these logs are always enabled. You can view the activity log under the Event Hub namespace.

Diagnostic Log
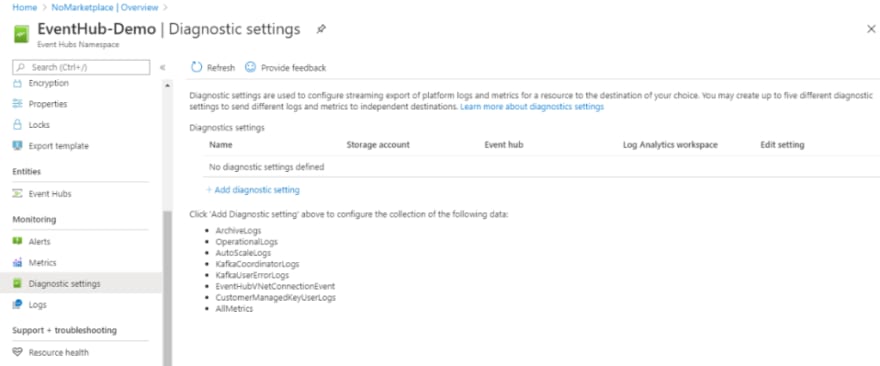
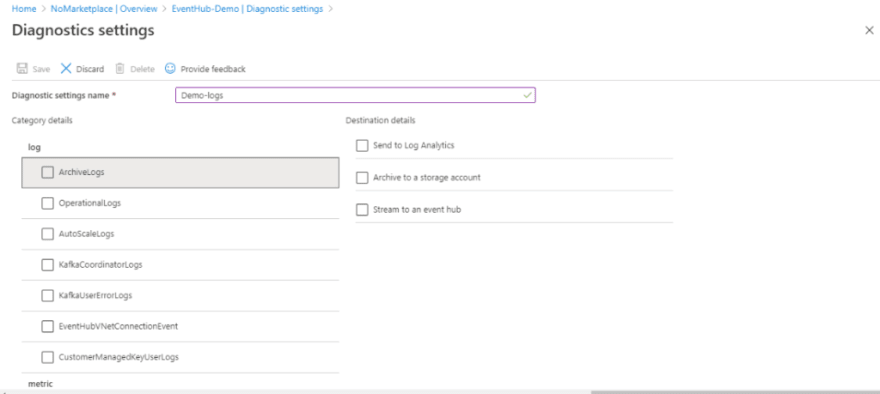
Diagnostic logs capture well-provided information about all the actions and operations that take place under the Event Hub namespace. A diagnostic setting specifies a list of categories to perform logs and metrics to be collected from the resource and one or more destinations to stream them.
To create a Diagnostic log,
• Click on Diagnostic settings under the Monitoring section.
• Click on Add diagnostic setting

• Under the Category details, you can choose the log that is to be enabled
• In the Destination details, you can choose your destination

To know more about event logs and configurations related to it check, Logging events to Event Hubs
Monitor Event Hubs in Serverless360
Serverless360 offers managing and monitoring of Azure resources like Logic Apps, Function Apps, Service Bus Queues, Topics, Event Hubs, Event Grid, etc., Azure provides the resource level monitoring on their metrics, but the actual need would be Consolidated monitoring at the application level. For monitoring Azure Event Hubs from multiple perspectives, Serverless360 has three types of monitors: Status Monitor, Threshold monitor, and Data monitor.
How Do I Check My Data Usage on Event Hub?
You can use Azure metric page or other third-party tools like Serverless360 to monitor on the data usage on event hubs. The data usage can be monitored on the namespace level or even at Event hub level.
Conclusion
Azure Event Hubs help in processing millions of event data and monitors the metrics at the entity level. Serverless360 provides consolidated monitoring at the application level. In Azure, only a couple of metrics can be configured to be monitored but in Serverless360 you can monitor entities on multiple metrics. Enhance the performance of your Event Hub with Serverless360
21
