28
AWS: Simple Email Service Bounce rate and monitoring with and Prometheus

Recently, AWS blocked our AWS Simple Email Service because of its low bounce rate.
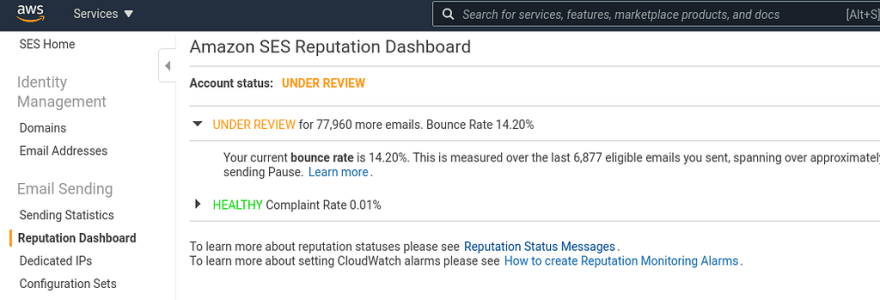
This can be checked in the AWS SES > Reputation Dashboard, our account currently has Under review status:

After we’ve connected AWS Tech Support, they enabled it back, but we must solve the issue asap, and have to monitor AWS SES Bounce rate in the future to avoid such situations.
In this post, we will take an overview of the Bounce and Complaint rating for emails in general, and then will configure AWS SES monitoring and alerting with hAWS CloudWatch and Prometheus.
AWS can block an SES account because of a high Bounce rate or Complaint rate. In case of its high ratings, remote email servers can stop accepting new emails from IPs of AWS by marking them as “spam”, so AWS is closely monitoring those indicators.
Let’s see what are Bounce and Compliant ratings, and then will configure Prometheus Alertmanager to send an alert if they will reach 5% of the Bounce rating and over 1% of the Compliant rate.
Check the What can I do to minimize bounces? for some additional info.
Bounce rate defines which part of recipients didn’t receive emails, see Bounce Rate.
its value is counted as (number of bounced / total sent) * 100, e.g:
>>> (10.0/10000)*100
0.1
Here we’ve got the 0.1% — great result if it could be real for us :-)
Also, the Bounce rate is distinguished as hard and soft ratings.
- Hard bounce : is when a recipient’s email server refuses to accept an email at all. This can happen due to a wrong email address, its domain on the remote server, or if the server can’t accept new emails at all
- Soft bounce : is when a recipient’s email server accepted an email but wasn’t able to deliver an email to a user’s mailbox, for example, due to disk quotas for a user or because of an email’s size
Complaint rate is counted when a recipient explicitly notifies that he doesn’t want to get an email from the sender, for example by pressing the “Spam” button in its mail client or by sending abuse to the AWS SES.
For alerting we can use AWS CloudWatch metrics for AWS SES:
- Sends: total emails being sent
- Deliveries: total emails being delivered to a recipient’s mailbox
- Bounces: a recipient’s mail server refused to accept an email (counted as hard bounces)
- Complaints: an email was delivered to the recipient’s mailbox, but was marked as spam
Also, we have two additional recalculated metrics here for the Bounce and Complaint — Reputation.BounceRate and Reputation.ComplaintRate.
At this moment, our Reputation.BounceRate == 0.1432, i.e 14%:

(at the end of this post it will grow to 18% — we’ve got an additional 4% per day)
There are two ways for alerting: by using AWS CloudWatch Alerts and SNS, see Creating reputation monitoring alarms using CloudWatch, or by collecting those metrics to an external monitoring system.
In our case, we will collect them to a Prometheus instance which will then use its Alertmanager to send alerts to the Opsgenie, and Opsgenie will forward them to our Slack.
Usually, we are using the yet-another-cloudwatch-exporter, but for the AWS SES metrics it displayed garbage, on its Github Issues questions are answered very rarely, and in general, for now, it seems like an abandoned project.
So, for SES we will use a common exporter, see the Prometheus: CloudWatch exporter — сбор метрик из AWS и графики в Grafana (rus).
It’s config file:
region: us-east-1
set_timestamp: false
delay_seconds: 60

metrics:

 - aws_namespace: AWS/SES
   aws_metric_name: Send

 - aws_namespace: AWS/SES
   aws_metric_name: Delivery

 - aws_namespace: AWS/SES
   aws_metric_name: Bounce

 - aws_namespace: AWS/SES
   aws_metric_name: Complaint

 - aws_namespace: AWS/SES
   aws_metric_name: Reputation.BounceRate

 - aws_namespace: AWS/SES
   aws_metric_name: Reputation.ComplaintRate
To check the metrics, w can use a Python script from the AWS: SES — Simple Email Service и WorkMail: настройка аккаунта и отправка почты post (rus), that will send an email every 10 seconds:
$ watch -n 10 ./ses_email.pyAdd some grahs to Grafana:
aws_ses_reputation_bounce_rate_sum{job="aws_ses"}

aws_ses_reputation_complaint_rate_sum{job="aws_ses"}

avg_over_time(aws_ses_reputation_bounce_rate_sum{job="aws_ses"}[1h])

aws_ses_send_sum{job="aws_ses"}

aws_ses_delivery_sum{job="aws_ses"}

aws_ses_bounce_sum{job="aws_ses"}

aws_ses_complaint_sum{job="aws_ses"}
Compare them with metrics on the CloudWatch dashboard to be sure they are correct:

And now we need only to create an alert.
But here is a problem.
From the graph, we can see that the Bounce Rate is displayed with gaps (on the left side):

About every 20 minutes we start sending our emails (5–6 on the graph are our testing, which are sent by the script mentioned above), and once we’re sending emails — we can see the aws_ses_reputation_bounce_rate_sum.
So, if using a simple alert like:
- alert: AWSSESReputationBounceRate
  expr: aws_ses_reputation_bounce_rate_sum{job="aws_ses"} * 100 > 5
  for: 1s
  labels:
    severity: warning
  annotations:
    summary: 'AWS SES Bounce rate too high'
    description: 'Latest observed value: {{ $value | humanize }} %'
    tags: aws
It will be activated and closed on itself each 20 minutes as well.
What we can do here?
As a solution — the avg_over_time() function can be used here with a period in 10 or 20 minutes, then we'll see the graph without gaps:

Update the alert (1 hour used here):
- alert: AWSSESReputationBounceRate
  expr: avg_over_time(aws_ses_reputation_bounce_rate_sum{job="aws_ses"}[1h]) * 100 > 5
  for: 1s
  labels:
    severity: warning
  annotations:
    summary: 'AWS SES Bounce rate too high'
    description: 'Latest observed value: {{ $value | humanize }} %'
    tags: aws
And got a notification to Slack:

Done.
Originally published at RTFM: Linux, DevOps, and system administration.
28
