56
Visualize Your Hardware Topology Using hwloc
With multiple cores, shared caches, and NUMA architectures, modern computer platforms are becoming more sophisticated. Improving the efficiency of high-performance computing applications necessitates knowledge of both the application and the platform on which it operates, which can be challenging.
The sharing of many layers of caches among cores has resulted in a hierarchical hardware topology. The hierarchical structure of today's processors is further stressed by Non-Uniform Memory Access (NUMA) technology. The rising complexity and parallelism among computing nodes creates the conundrum of how to plan work in order to limit the impact of this complexity while yet enhancing efficiency. Two closely cooperating tasks, for example, should be clustered on cores with a shared cache. Two independent memory-intensive processes should be split across several sockets to improve memory throughput. But how do you make this selection if you don't have the visibility into the hardware topology?
It is vital to understand and have visibility into the hardware locality in order to successfully employ modern hardware for the aforementioned scenarios. Hardware Locality (hwloc) and Network Locality (netloc) are two programs that can assist you.
These two programs are hosted by the Open MPI Team. The Open MPI project has many members, contributors, and partners. Some of the contributors to Open MPI project are Amazon, ARM, AMD and Facebook.
From Open MPI website[1], "hwloc software package provides a portable abstraction of the hierarchical structure of modern architectures, including NUMA memory nodes, sockets, shared caches, cores, and simultaneous multithreading (across OS, versions, architectures, etc.). It also collects information about cache and memory, as well as the location of I/O devices such as network interfaces, InfiniBand HCAs, and GPUs."
hwloc is intended to help high-performance computing (HPC) applications at a high level, but it may also be used by any project that needs to leverage code and/or data locality on modern computing platforms to use them wisely and efficiently. It is quite useful as an engineer to be able to visualize and better understand the hardware topology.
netloc and hwloc are both included in hwloc releases beginning with hwloc 2.0. netloc is still in its early stages of development, but it now supports InfiniBand and OpenFlow-managed Ethernet networks. netloc is now available for Linux and Mac OS.
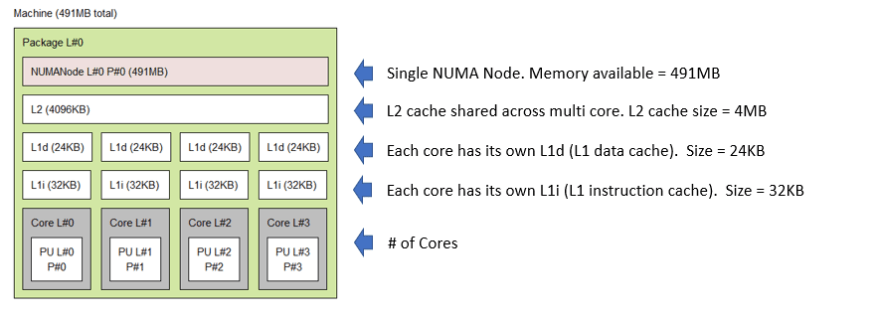
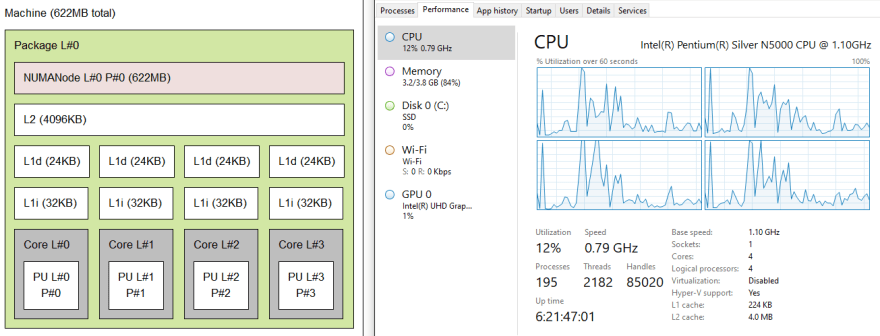
Here are some of the examples of hardware topology information you can gather using hwloc.

For more such examples as to what hwloc can provide, visit the lstopo link.
If you work as a high-performance computing engineer, it is good to spend some time learning about the hwloc tool and how to utilize it to tackle some of the issues you may face when exploiting hardware.
References:
Thanks for reading!
If you enjoyed this article feel free to share on social media 🙂
Github: hseera
56


