27
Electron Adventures: Episode 7: Visualize Free Disk Space In Terminal
For this adventure we'll do a small detour away from Electron, and answer the question - can you visualize free disk space in terminal without using any external programs?
I'll do this in ruby, but you can use node if you want. Node is just not great for writing terminal programs.
Terminals used to just display characters, but they keep getting more and more functionality. There's no standard way to display images on them, but iTerm supports it with a custom extension and we'll be using that.
So here's a script that will display an image in iTerm:
#!/usr/bin/env ruby

require "base64"

def imgcat(data)
  print [
    "\e]1337;File=",
    "size=#{data.size}",
    ";inline=1",
    ":",
    Base64.strict_encode64(data),
    "\a",
  ].join
end

unless ARGV.size == 1
  puts "Usage: #{$0} <filename>"
  exit 1
end

path = ARGV[0]
data = open(path, "rb", &:read)
imgcat(data)
print "\n"
It's basically just some control characters and Base64 dump of the image in any supported format, which is most of them except notably not SVG.
And here's what it looks like:

Ruby is a bit more expressive than javascript, especially its more powerful regular expression engine, so getting the free disk space information is easy:
def df
  `df -kP`
    .lines[1..-1]
    .map{|line| line.chomp.split(/\s+(?=[\d\/])/) }
    .map{|_,total,used,_,_,path| [total.to_i, used.to_i, path]}
end
If you're confused by this or other regular expressions, try regex crossword game.
Now what we'd like the most is generate some SVG. This can be done using ImageMagick convert program, but we'll do something else.
Most image formats are very complicated, but PNM is easy enough to generate by hand. It's just three line header followed by raw pixel values.
- first line says
P6- this means binary RGB image format - second line says
xsize ysize - third line says
255- that's max number of colors per channel for each pixel - then it goes from top to bottom, left to right on each row, RGB (many image formats go backwards, or have pixel channels in opposite order, no idea why)
We'll be generating just very simple red and green progress bar images, so here's the function for it:
def generate_progress_bar(xsize, ysize, perc)
  red = "\xFF\x40\x40".b
  green = "\x40\xFF\x40".b
  [
    "P6\n".b,
    "#{xsize} #{ysize}\n".b,
    "255\n".b,
    ysize.times.map{
      xsize.times.map{|x| x > perc*xsize ? red : green}.join
    }.join,
  ].join
endNow let's call the methods we wrote:
df.each do |total, used, path|
  perc = used / total.to_f
  perc = 0.0 if total == 0
  data = generate_progress_bar(100, 20, perc)
  imgcat(data)
  printf " %3d%% %s\n", (100.0 * perc), path
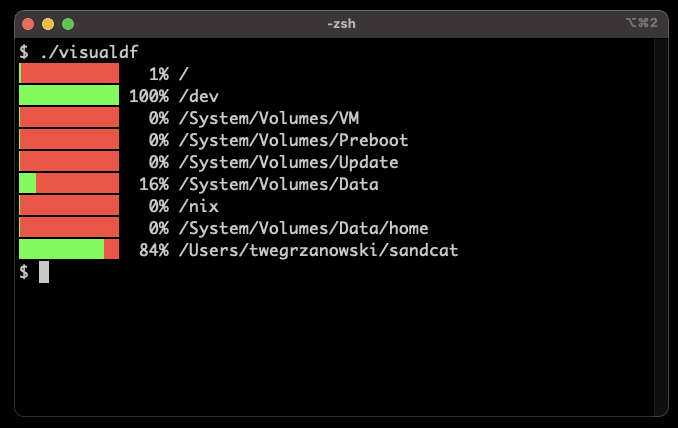
endHere's the result:

But wait! iTerm might be Mac specific, but it only matters where for where we display the output. It can be generated from any system.
Here's a result of sshing to a Windows machine running cygwin, and displaying it from iTerm on a Mac:

As usual, all the code for the episode is here.
See you in the next episode where we'll get back to actual Electron.
27
