26
The best python logging setup
We have an opinionated configuration for logging at Panprices. In our context, it feels like the best logging solution ever, and I couldn't be prouder of our team, who worked hard on figuring out all minor details!
We want the logs to be structured so that we can easily search and analyze them in GCP. Locally the logs should be human-readable, and exceptions should be easy to parse.
To start, we decided to use structlog, which is a fantastic logging tool. With that, our logs can be JSON-formatted on our servers but look beautiful in our terminals when working locally.
My favorite feature with structlog is how you can append any data as key-value pairs, and it won't just clutter up your terminal as structlog highlights your primary message.

Sometimes we get bugs that are very difficult to debug, and we wish we had more information. We have solved this in some of our services by logging as much information as possible in large blobs. That manifests as large non-prettified JSON blobs that GCP treats as strings.
When not using a proper structured logger, it's a tradeoff between debugging in the dark and information overload. When we use structlog, we can have fewer but richer log statements that contain explorable JSON payloads. We can look for just the information we need.
As with any powerful tool, you can configure structlog to infinity. Even though the documentation is vast, it can be challenging to figure out some details. We got stuck on some pitfalls, so here is how our configuration works.
We want to configure structlog at startup, and we do that by calling a function at startup.
# src/helpers/structlog

import structlog
from structlog.dev import set_exc_info, ConsoleRenderer
from structlog.processors import StackInfoRenderer, TimeStamper, add_log_level

def config_structlog():
    structlog.configure_once(
        processors=[
            add_log_level,
            StackInfoRenderer(),
            set_exc_info,
            TimeStamper(fmt="%Y-%m-%d %H:%M.%S", utc=False),
            ConsoleRenderer(),
        ]
    )
In our main.py, we use this helper function like this:
from src.helpers.structlog import config_structlog
import structlog

config_structlog

def hello_world(_request):
    logger = structlog.get_logger()
    logger.msg('hello world')

    return "", 200
This config will always print out the logs in a human-readable format. But on the server, we want it in plain JSON so that GCP can parse it. To solve this, we use an environment variable (ENVIRONMENT) that can be set to local or production.
If ENVIRONMENT is set to production, we will use a JSON renderer instead of the ConsoleRenderer. We also don't care about timestamps as GCP adds timestamps regardless.
The last thing we need to add is GCP severity and message. You can skip this if you don't use GCP. Structlog will print out what type of log it is ('debug', 'info', 'warn', 'error', etc.) under level while GCP expects it to be uppercase and under severity. Another default behaviour is that GCP will print our whole json-message in the summary line if we don't include a message. We can solve that by creating our own processors (_GCP_severity_processor and _GCP_add_display_message).
Edit from the future (2022-01-04): We learned that if you add a property called
After these changes, our setup-function looks like this:
import os
from typing import Any
import structlog
from structlog.dev import set_exc_info, ConsoleRenderer
from structlog.processors import StackInfoRenderer, TimeStamper, add_log_level


def config_structlog():
    # Custom renderer when in development:
    if os.getenv("PP_ENVIRONMENT") == "local":
        structlog.configure_once(
            processors=[
                add_log_level,
                StackInfoRenderer(),
                set_exc_info,
                TimeStamper(fmt="%Y-%m-%d %H:%M.%S", utc=False),
                ConsoleRenderer(),
            ]
        )
    else:
        structlog.configure_once(
            processors=[
                add_log_level,
                StackInfoRenderer(),
                set_exc_info,
                _GCP_severity_processor,
                _GCP_add_display_message,
                structlog.processors.JSONRenderer(),
            ]
        )


def _GCP_severity_processor(
    logger: Any,
    method_name: str,
    event_dict: Any,
) -> Any:
    """
    Add GCP severity to event_dict.

    Level is not a perfect one to one mapping to GCP severity.
    Here are the avaliable levels/method names:
        - debug
        - info
        - warning
        - warn (translates to warning as level)
        - error
        - err
        - fatal
        - exception
        - critical
        - msg
    """
    event_dict["severity"] = event_dict["level"].upper()
    del event_dict["level"]
    return event_dict


def _GCP_add_display_message(
    logger: Any,
    method_name: str,
    event_dict: Any,
) -> Any:
    """
    Add display message to event_dict.

    By default GCP logs will just show a string representation of the full blob.

    To show the message only you can use this processor.
    """
    event_dict["message"] = event_dict["event"]
    del event_dict["event"]
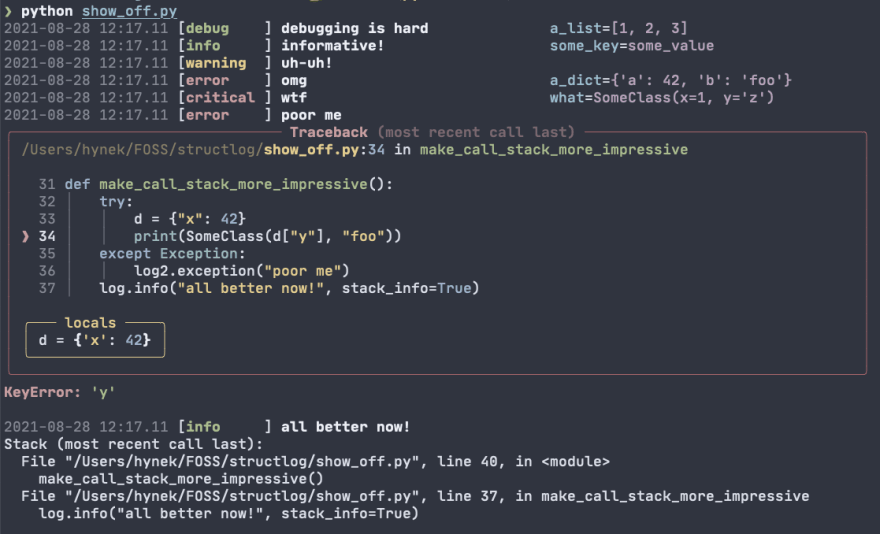
return event_dictEven though I try to practice bug-free-driven development, I sometimes get Exceptions that I hadn't expected. I think the default stack trace is okay, but there is a way to get a much more parsable stack trace in your terminal with much more information.
By just installing rich (run pip install rich), you get beautiful, pretty printed exceptions. They look like this:

There is only one thing to look out for. Ensure that you are in an except-block when you use log.exception() because otherwise rich will crash.
- Install structlog and rich.
- Copy the large code block in a file called
src/helpers/structlog.pyand call it before using the logger. - Enjoy and savor your wonderful logs!
Can you think of any improvement to our config, or do you feel that I missed something vital? Please leave a comment!
26
